How does this autosomal graph make sense

Khalid_1

Regular Member
Messages
19
Reaction score
7
Points
0
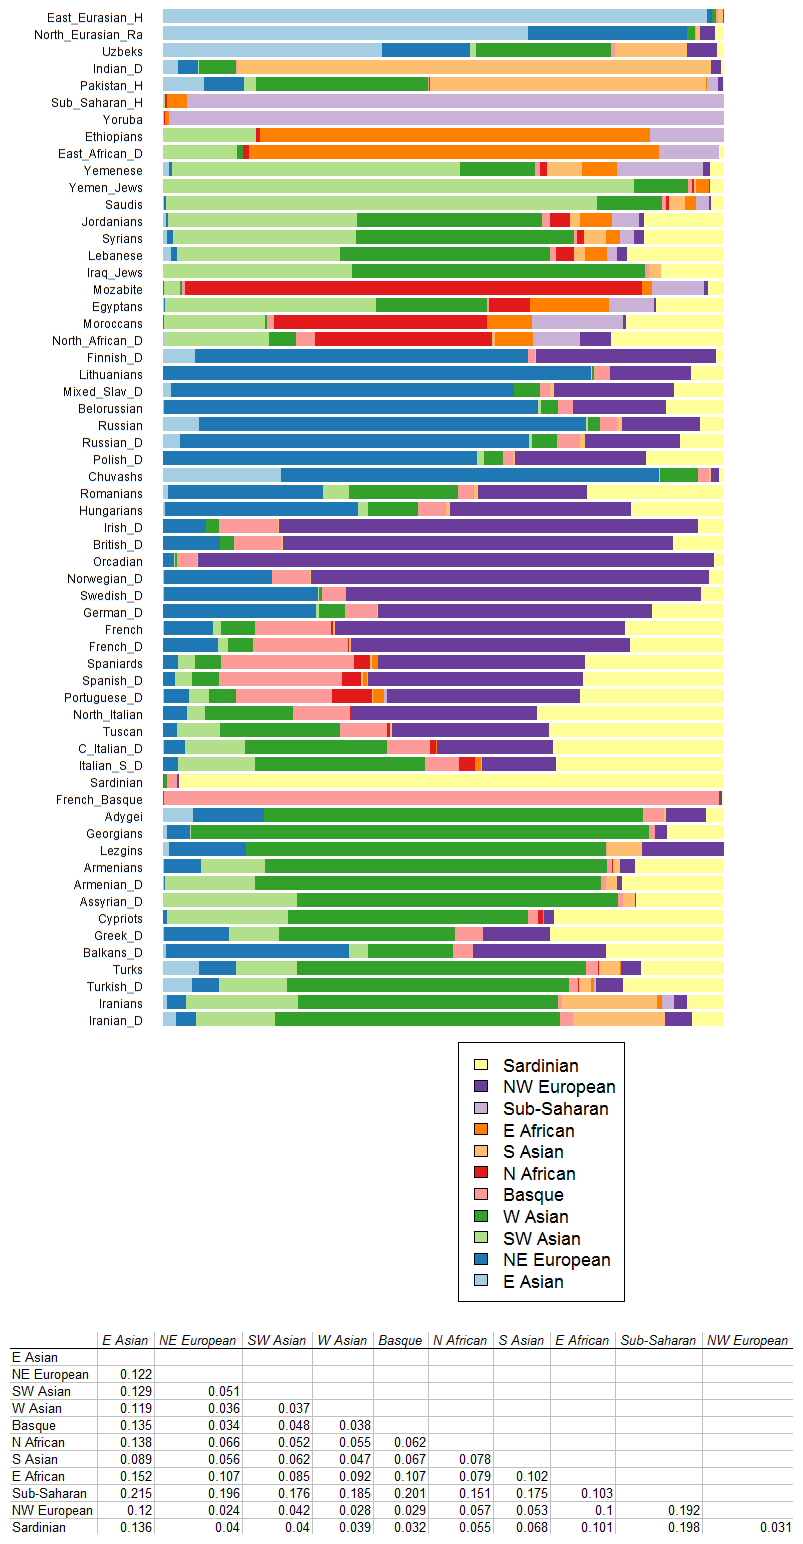
I dont understands how does these kind of graphs work

ADMIXTURE_11.png


According to this graph, Egyptians are 22% east african and subsaharan, and Moroccans have 24.1% east african and subsaharan (I calculated it). But as you know, black african (just like east asian) is very distinct and dominant in appearance, so having even just 10% or 15% east asian or african black is very obvious on a person's appearance. But most Egyptians and Moroccans look nothing like black african. So how do you explain this graph?

This is what an average Egyptian looks like, these pictures are from a random selection of Egyptians twitter users

9j3OXic4.jpg


vyNIy9yB.jpg


SEnjUIKJ.jpg


8C55eVsg.jpg


I don't see 22% black african, not even 5%. How do you explain the graph?
 
if 22% is a population average, it stands to reason some people will have a higher % sub-saharan admixture and some will have a lower percentage. I think the origins of this admixture to a north african population might have something to do with feature representation within those populations. I think those graphs are just meant to be visual indicators of the different mixes in various populations, and would explain why someone in Morocco, or Egypt or Tunisia with 20% african ancestry might look different from an American with 20% african ancestry (my theory is that their appearance is modified by the inclusion of southern european, berber and west asian ancestry) and are meant to give you a quick snapshot at the briefest glance. But without the study's parameters of what each subgroup represents, what areas are included in each category, etc. etc., it's probably safer to take the results with a grain of salt. i think a wide berth can be given on some of those results, look at gedmatch which tells you, in theory, the same information 40 different ways :)
 
if 22% is a population average, it stands to reason some people will have a higher % sub-saharan admixture and some will have a lower percentage

Perhaps you are not familiar with how an Average Egyptians and Moroccans looks, thats why I added the pictures. in terms of color and shape of nose and other black african futures, they look the same as the people in this picture in this aspect. So 22% is very high. One would think (by observation) that a more reasonable % is from 2% to about 6% or 7% (from north to south), except the extreme south.

This is why I ask how does these kind of graphs work? how do they determine reference groups? if it is determined by attributing to each group the genetic markers that originate with them, and mostly common among them, then thats a reasonable method. But if they include even outside and recent admixture then these kind of graphs becomes misleading. For example east africans have relatively high % of J1, is that included in them as a reference group? because Egyptians for example have hight % of J1, but from a different source. Both groups have the J1 from a shared source (Semites). So it wouldn't make sense to include J1 in the East African reference group. According to this graph Egyptians only have a tiny trace of North African, how is that even possible?
 
Twenty-two to twenty-five percent SSA in American terms is a quadroon. A lot of North Africans look like quadroons to my eyes, including the ones posted above.

Here is a photo of one of the last "quadroon" balls in Louisiana. A good number may have actually been octoroons; there's no way of knowing.

41ac7ed52afcf258c2fe7d903c9703ca.jpg


Even within one family, with the same percentage of "white" blood, there was variation:

883b62f439dc368a65fc0cbd16d62812.jpg


That's why some of the siblings in a family could "pass" or disappear into white society, and some couldn't. That's what happened with Thomas Jefferson's children.

Plus, as selectivememri pointed out, those are averages. There are going to be some people with more SSA, and some with quite a bit less.

Anwar Sadat looked mulatto to me, or even more than that.
sadat.jpg


Nilotic admixture does look different than West Nigerian admixture though.

There's a difference in appearance between North Africans and African Americans on top of the huge differences in percentages(80% African for African Americans, and 20% African for North Africans), and that's that the admixture at least in the eastern part of North Africa is often more "East African" than "West African", while the admixture in American blacks is almost all "West African". The other difference is the admixing West Eurasian populations.

Some East Africans are close to forty percent West Eurasian using more sophisticated methods, so when they have children with West Eurasian descent people, the children can look very West Eurasian even if "on paper" they're mulattos. The child of a Nigerian and a European could look much more "African".
 
Interesting!

By the way Al Sadat is more than a mulatto, his extended ancestry is mixed but mostly black

I can kind of see that in Egyptians, now that I googled some pictures of
quadroon, but I still don't see 25% in other NA
more like 15%

Anyway, the key question is what is the method of determining reference groups?

For example east africans have relatively high % of J1, is that included in them as a reference group? because Egyptians for example have hight % of J1, but from a different source. Both groups have the J1 from a shared source (Semites). So it wouldn't make sense to include J1 in the East African reference group. According to this graph Egyptians only have a tiny trace of North African, how is that even possible?
 
Interesting!

By the way Al Sadat is more than a mulatto, his extended ancestry is mixed but mostly black

I can kind of see that in Egyptians, now that I googled some pictures of
quadroon, but I still don't see 25% in other NA
more like 15%

Anyway, the key question is what is the method of determining reference groups?

That looks like an ADMIXTURE graph, which is created by the ADMIXTURE program. What happens with unsupervised runs is that you basically tell the algorithim to divide the populations you've included into "clusters". (So, certain choices might change the results.) You then look at where geographically a cluster is most frequent. \So, one cluster peaks in Sardinians, so most creators would call that the "Mediterranean" cluster. The cluster that peaks in northeastern Europe might be called Northern European, and on and on.

The problem is that the people who live in Northern Europe are not some "pure" ethnic group. Nor are Sardinians or anyone else. They have WHG, EEF, etc.

So, you have to know how to interpret ADMIXTURE results.

Maybe these would be helpful.

http://www.eupedia.com/forum/thread...Calculators-Have-To-Be-Interpreted-Cautiously

http://www.unz.com/gnxp/how-to-look...RazibKhansTotalFeed+(Razib+Khan's+total+feed)

As to Sadat, yes, at least mulatto; he looks like some African-Americans. Nasser is different, but I can still see the admixture.
Gamal-Abdul-Nasser-image-gamal-abdul-nasser-36461519-854-960.jpg


I don't know about Omar Sharif. I don't see any of that, but I don't know if he's actually full or even part Egyptian. I've read conflicting reports.

Omar-Sharif-315704.jpg
 
Thanks for the links. I read them but need to reread the article many times and research this topic so I can digest it.
But for now what I understood is that it is like what I said here:

Egyptians for example have hight % of J1, but from a different source. Both groups have the J1 from a shared source (Semites). So it wouldn't make sense to include J1 in the East African reference group.

Which is confusing to me, because the genes overlap in many areas. Hypothetically, if group A has 100% of only one lineage, and group B has 100% from another lineage, then the result, group C, of their admixture "assuming equal admixture in all mixes" will be 50% reference group A and 50% B.

Then A would mix with group D to produce group G, 50% A and 50% D. Then when G mixes with C (Lets call group E), each having 50% of reference group A, the result would be 25% A (from group C) + 25% B ( from C) + 25% D (from G) + 25% A (from G). Then Group E = 50 A, 25% B, and 25% D

In this scenario, group E would have 50% of component A, 25% comes from group C, and 25% from G. If we apply the method under discussion (the way I understood it). When group E is tested, using Groups C and G as reference. It would show 50% from G and 50% from C

But that would be wrong, because in realty 50% is from Group A, from which Group C and G have 50% each. You understand what I'm saying? because I don't
 
Thanks for the links. I read them but need to reread the article many times and research this topic so I can digest it.
But for now what I understood is that it is like what I said here:

Which is confusing to me, because the genes overlap in many areas. Hypothetically, if group A has 100% of only one lineage, and group B has 100% from another lineage, then the result, group C, of their admixture "assuming equal admixture in all mixes" will be 50% reference group A and 50% B.

Then A would mix with group D to produce group G, 50% A and 50% D. Then when G mixes with C (Lets call group E), each having 50% of reference group A, the result would be 25% A (from group C) + 25% B ( from C) + 25% D (from G) + 25% A (from G). Then Group E = 50 A, 25% B, and 25% D

In this scenario, group E would have 50% of component A, 25% comes from group C, and 25% from G. If we apply the method under discussion (the way I understood it). When group E is tested, using Groups C and G as reference. It would show 50% from G and 50% from C

But that would be wrong, because in realty 50% is from Group A, from which Group C and G have 50% each. You understand what I'm saying? because I don't

I'm not sure I do understand. Let's look at it this way.

What I think you have to keep in mind is that it's not the yDna that has pigmentation snps. Those are in the autosomal dna, where contributions are made both by all the men and all the women from whom you're descended.

In so far as I know, the consensus is still that yDna J1 arose somewhere in the northern Near East. The high levels in Saudi Arabia and other regions of the Gulf are the result of massive founder effects when that lineage moved south with herding. That's because of the extreme patriarchal nature of the culture and the resulting marriage patterns.

The mtDna, however, is much more varied, which tells us that the women came from various parts of the Near East, and in some cases even East Africa and India.

Then, selection acts on those snps. Evolution, except perhaps today in very industrialized countries, doesn't stop.

Let me give you one example. There are people in Chad who are R1b-V88. We are pretty sure that yDna lineage came down through the Levant from elsewhere, stayed for some time perhaps around Egypt, and then moved into Central Africa. However, they must not have brought all that many women with them. Their mtDna is SSA, and also, autosomally and in terms of appearance they are exactly like all the other groups around them who have typical SSA y Dna. Likewise, you can have J1 carrying men in East Africa who look basically "African".

So, no human group or tribe has been the same for ever back into the past. All modern human groups are the result of various migrations of ancient groups, and in most cases the modern "signatures" weren't "settled" until the Bronze Age at the earliest. A lot of the SSA in North Africa, for example, may be pretty recent indeed, after the Arab slave trade.


I understand what autosomal is. If you read my last comment long enough I'm sure you will understand my point.
 
I'm also skeptical, not only because morphometrically many North Africans are quite extreme (i. e. in many measurements West Africans cluster between South Africans and North Africans, or between North Africans and Europeans), but also because the standard West African outgroup is Yoruba, who are presented as unmixed Sub-Saharan-African. Signs of human settlement in Nigeria appear extremely late, and it is doubtful that the direct ancestors of present day Nigerians existed before the Neolithic ~3000 B.C. or even the local Iron Age.

Perhaps ADMIXTURE is picking up some shared Saharan ancestry? Hard to say without ancient samples from North Africa.
 
Crowds of Egyptians and North Africans are much more representative than individual pictures. They are a very heterogeneous population.
 

This thread has been viewed 6639 times.

Back
Top