Capitalis
Junior Member
- Messages
- 22
- Reaction score
- 28
- Points
- 13
- Location
- Wales
- Ethnic group
- Northwest European
- Y-DNA haplogroup
- U106>DF96>S15663
- mtDNA haplogroup
- H13a1a
Hello all. I've put together a little amateur study and welcome any observations or criticism. I tried talking my work through with Gemini AI but after a while using AI it feels like a cheerleader and becomes a shade too agreeable for my liking.
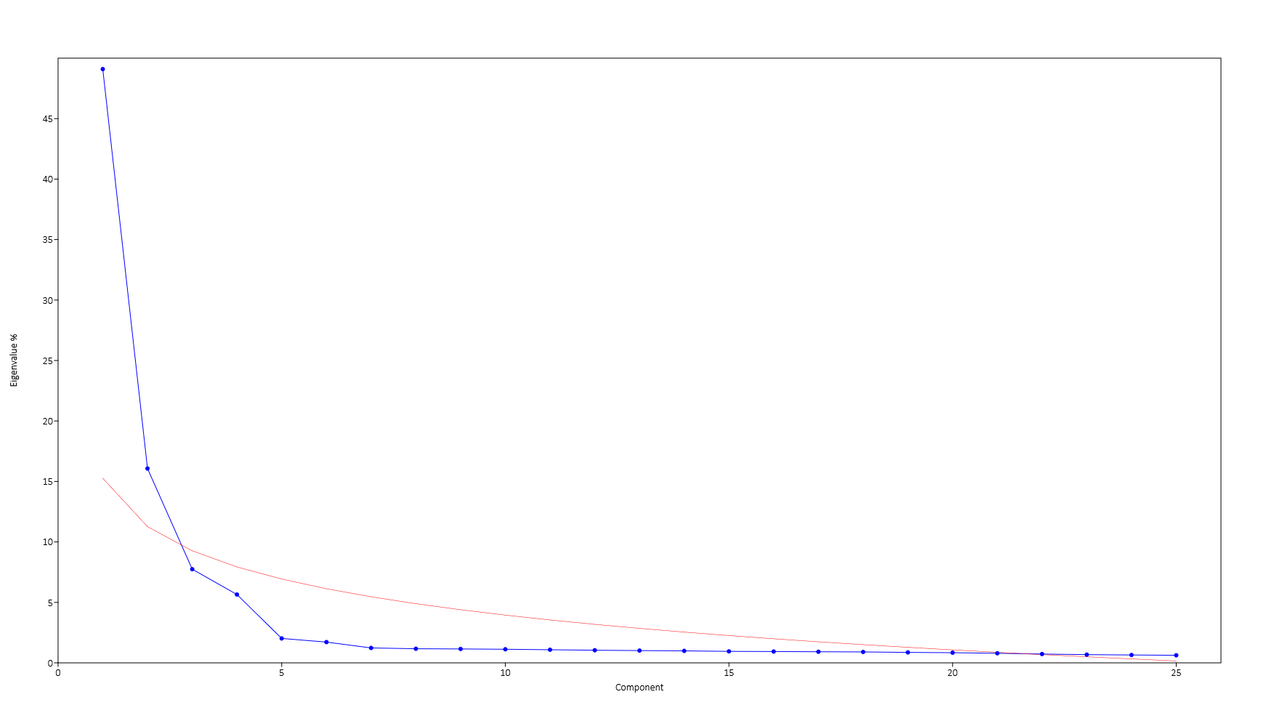
I made a few PCA plots using Eurogenes Global 25 data. Hopefully the plots are self-explanatory, but I added some comments to each plot as guidance. All PCA plots display PC 1 vs. PC 2. None of the other PCs reached significance on the scree plot.
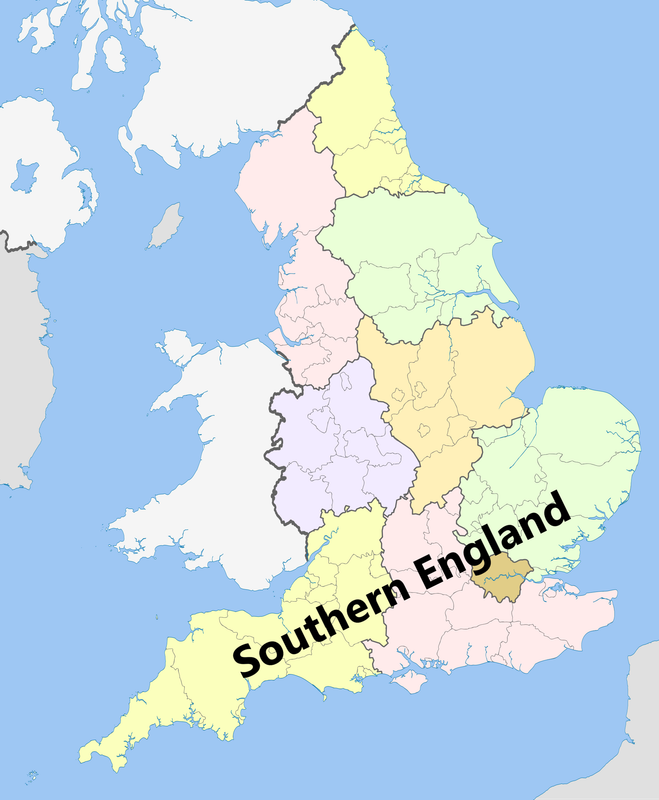
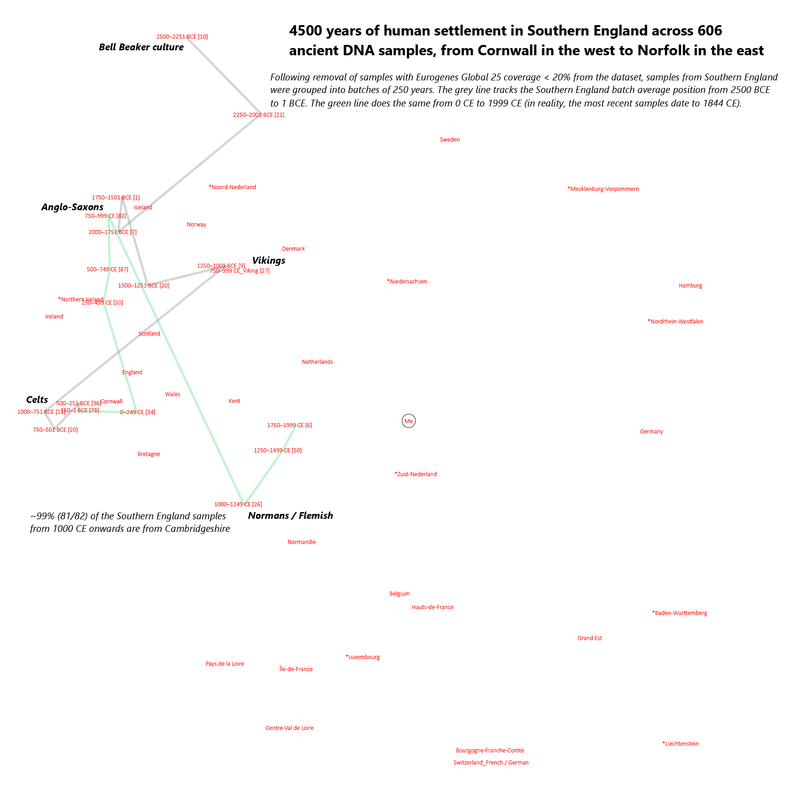
First, a map of the study area, namely Southern England (SW England, SE England, London, East Anglia).
 postimg.cc
Next, a time transect in PCA plot form of samples from Southern England. I perhaps should have made it clearer that the "Viking" label applies to the CE batch, not the BCE batch that occupies the same position.
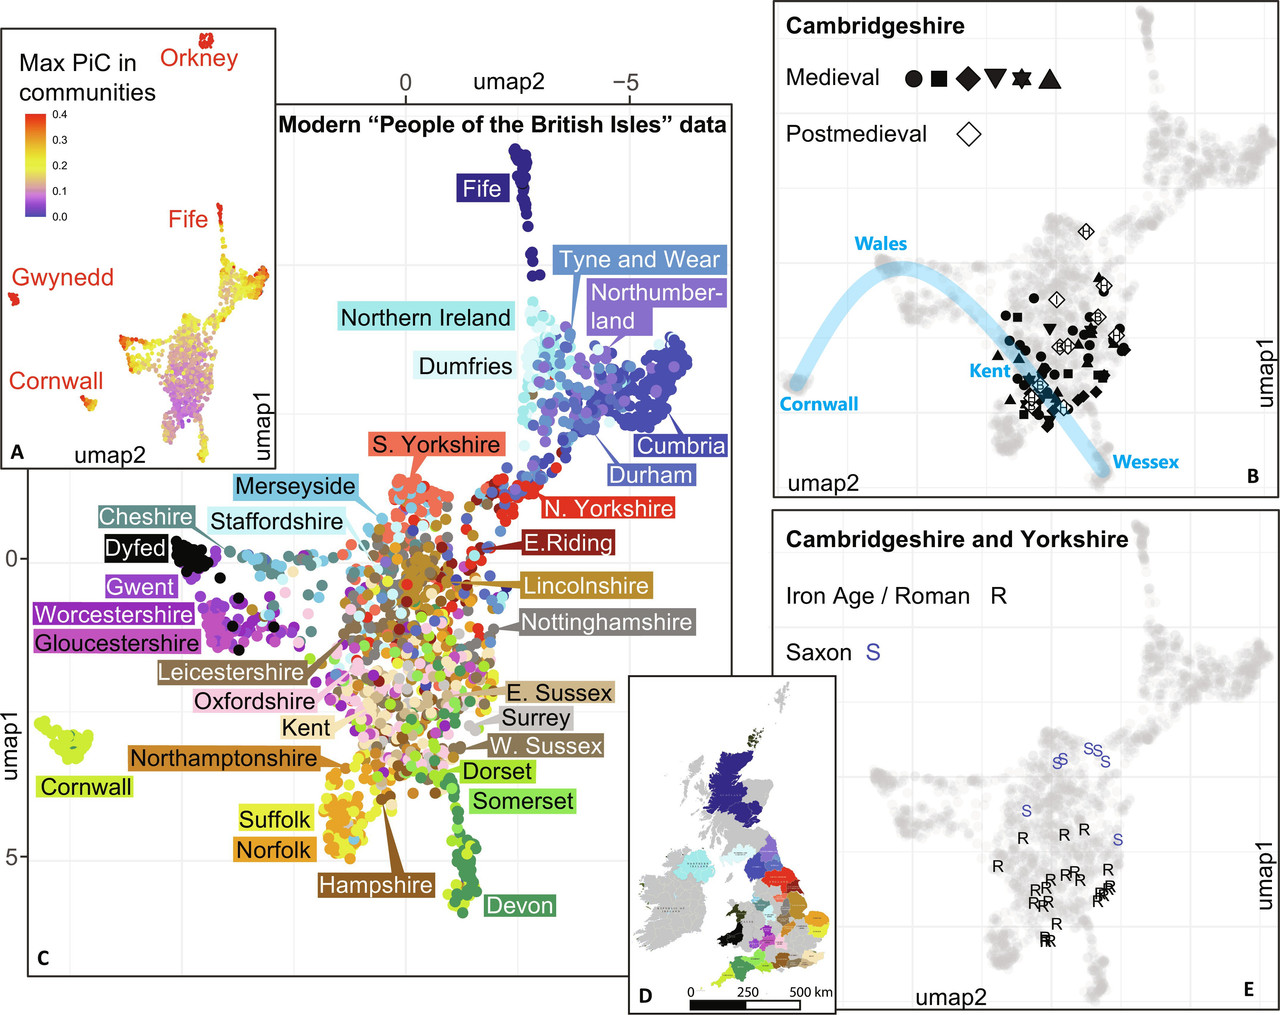
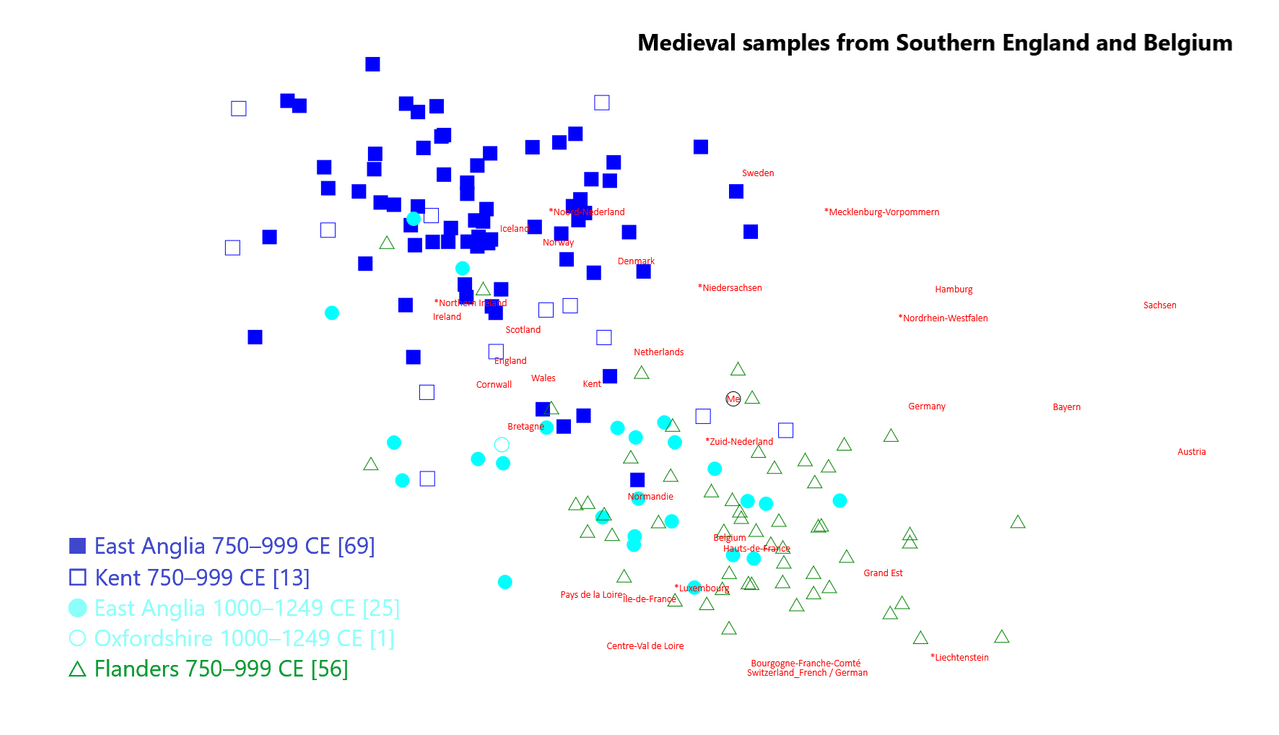
Next, UMAP plots from Genetic history of Cambridgeshire before and after the Black Death (2024), annotated by myself.
 postimg.cc
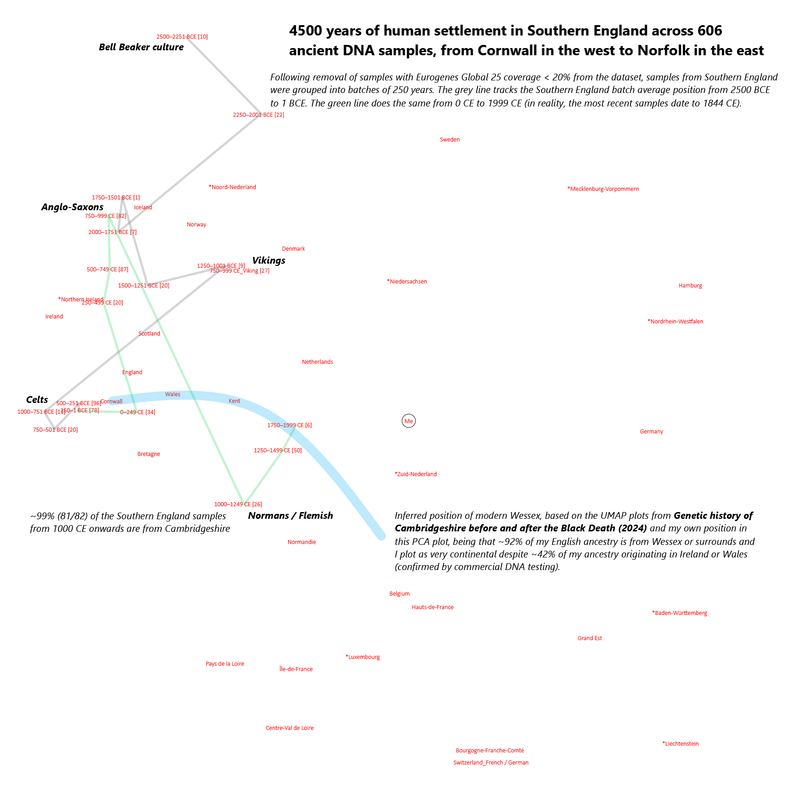
Next, the same time transect as before, but drawing a parallel to the "professional" UMAP plot.
Next, my LivingDNA results, to support my ancestry being correct.
 postimg.cc
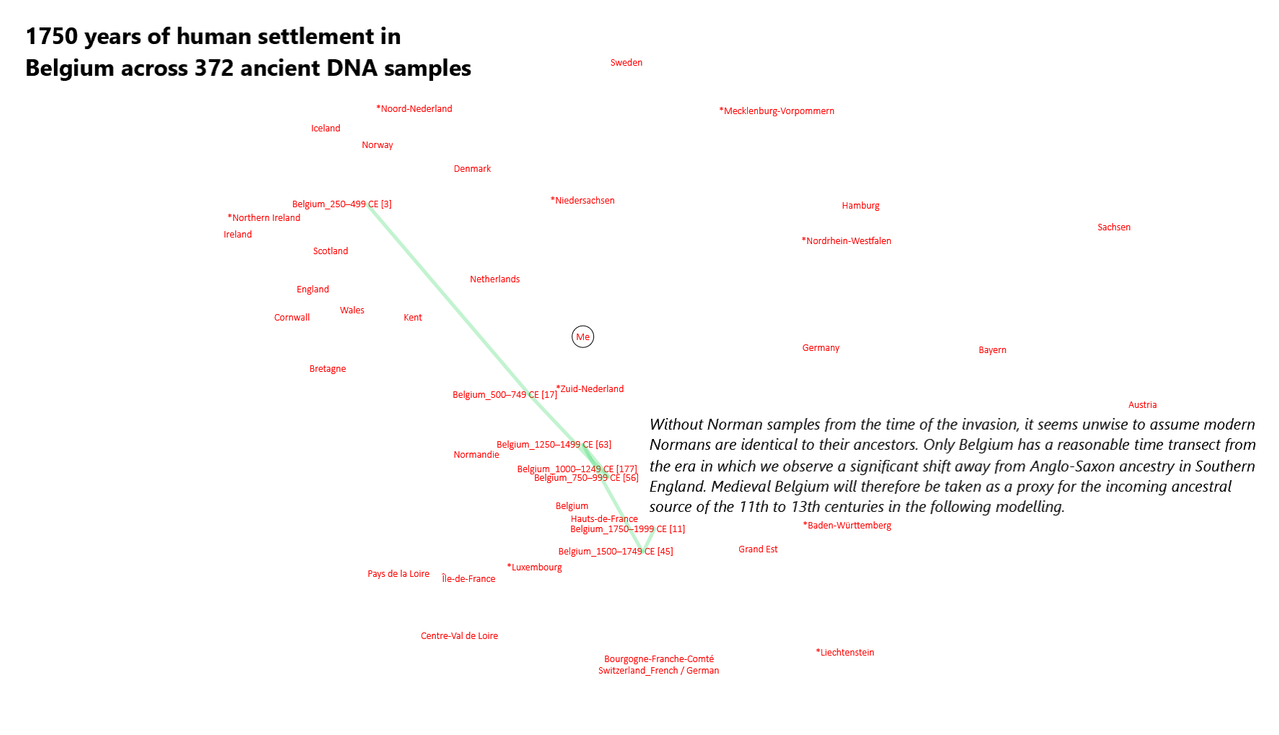
Next, a time transect of Belgium and a comment on Normans.
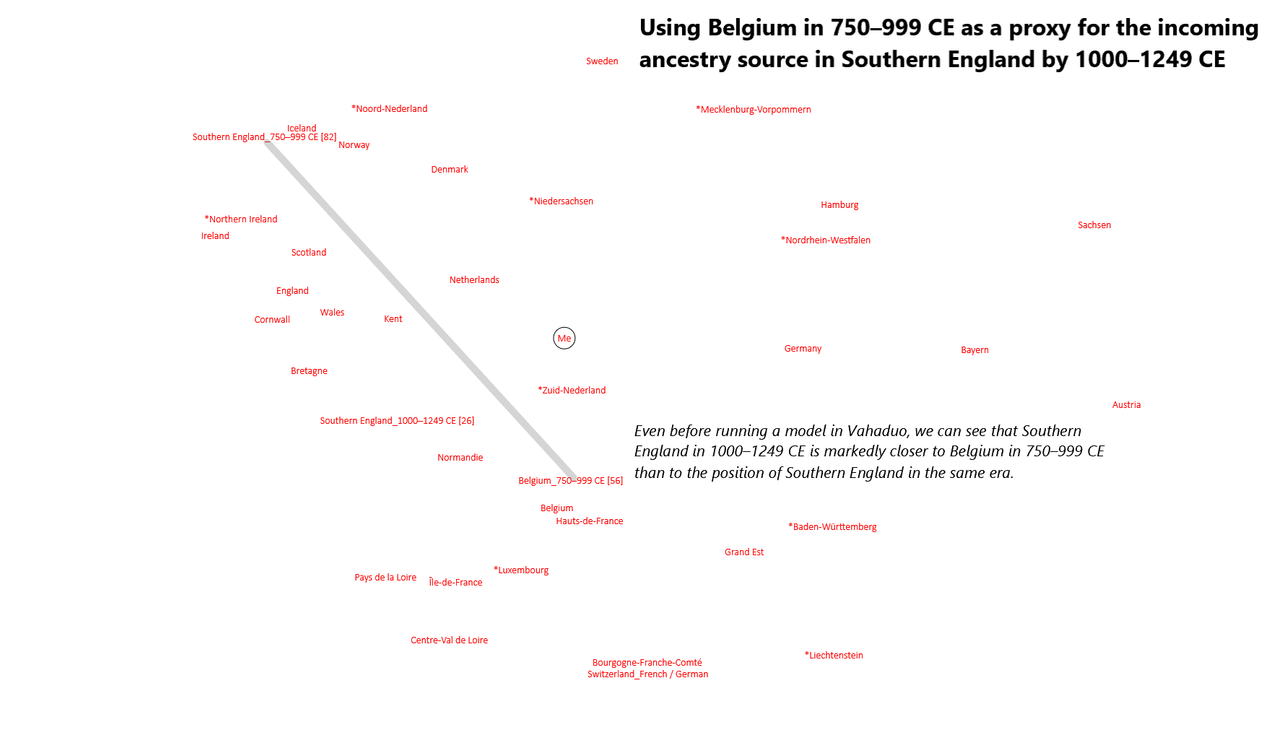
Next, using Medieval Belgium as a proxy for the new ancestry source in Medieval England, in PCA plot form...
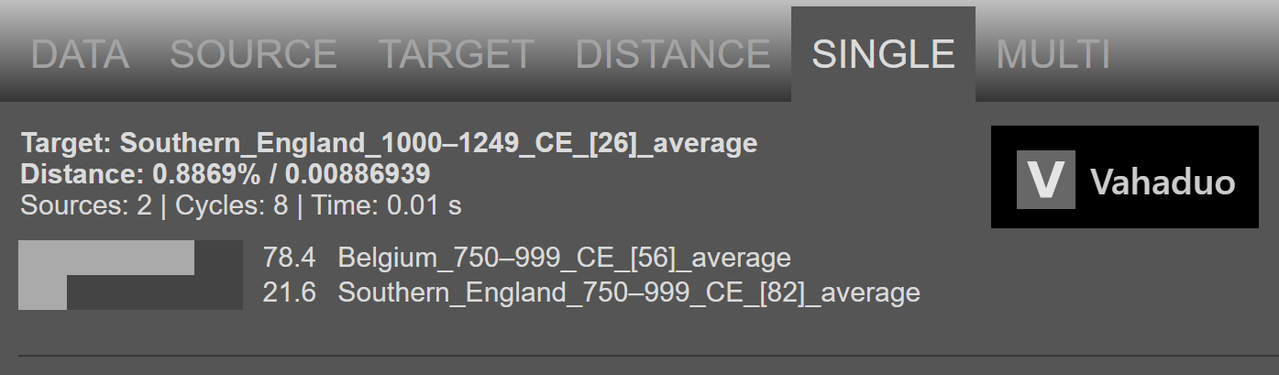
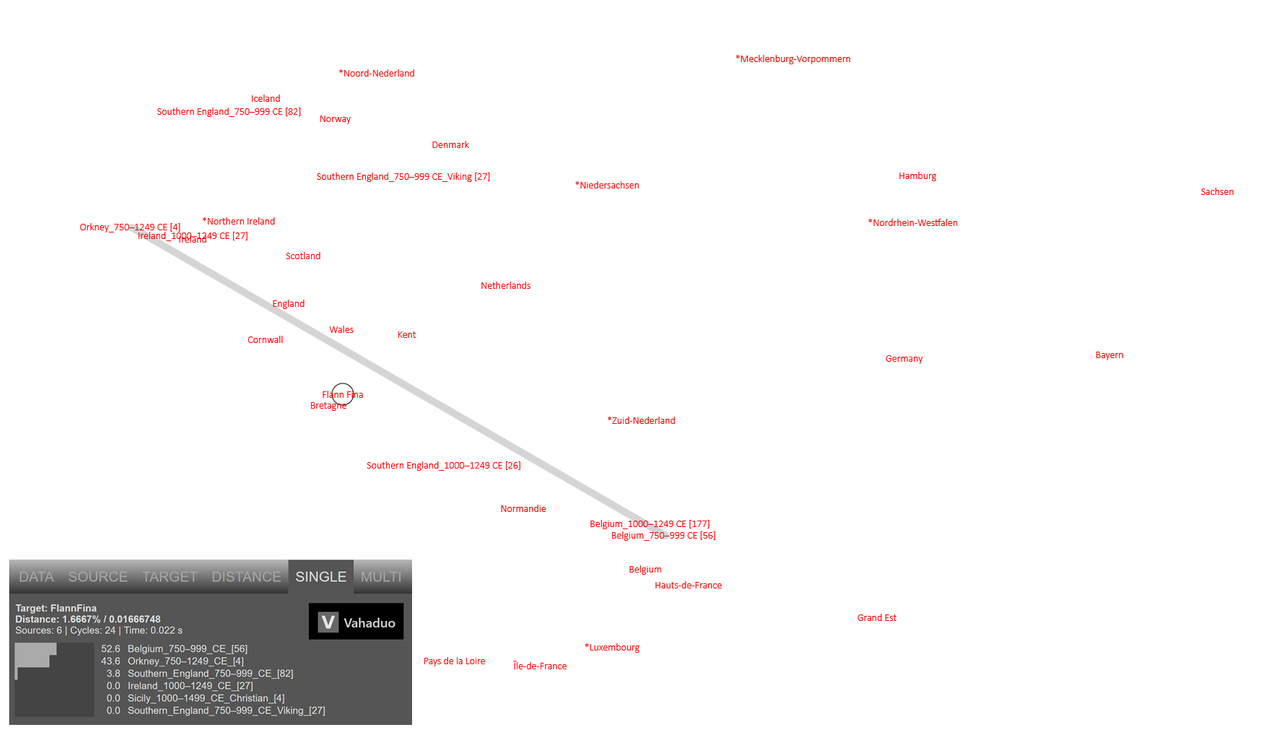
...and in Vahaduo modelling form.
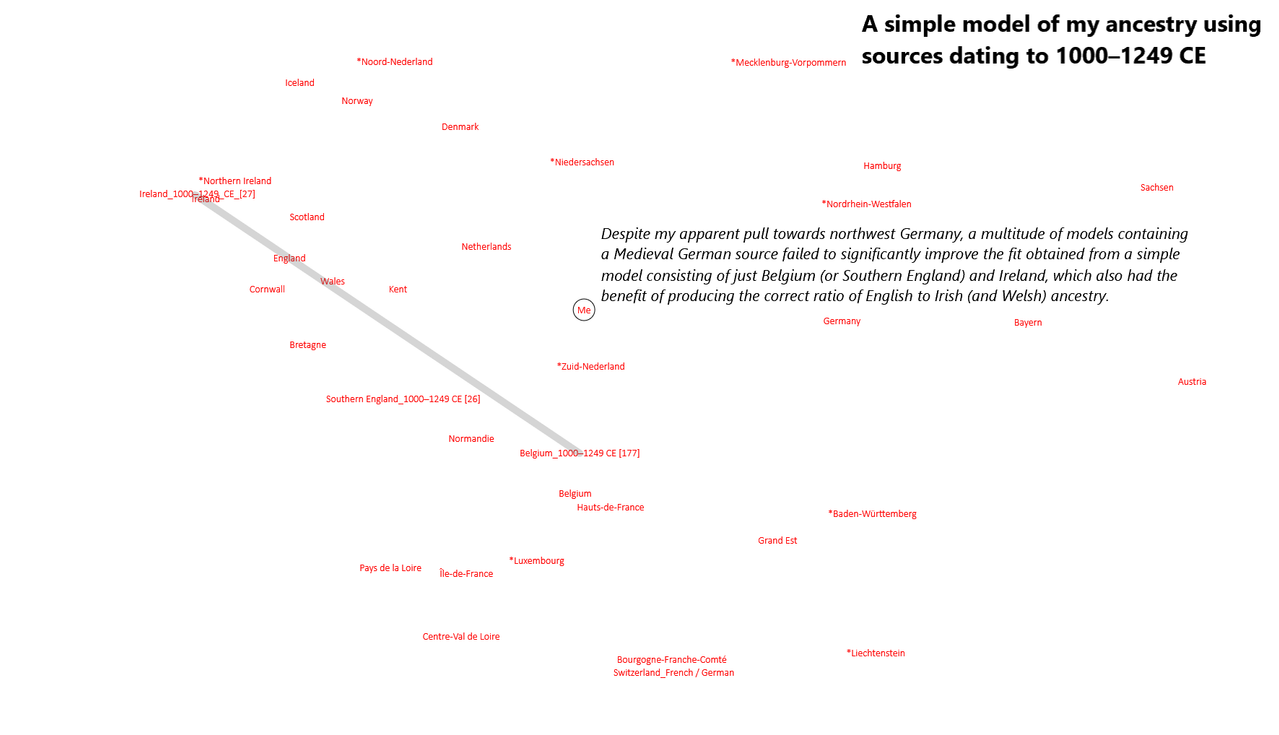
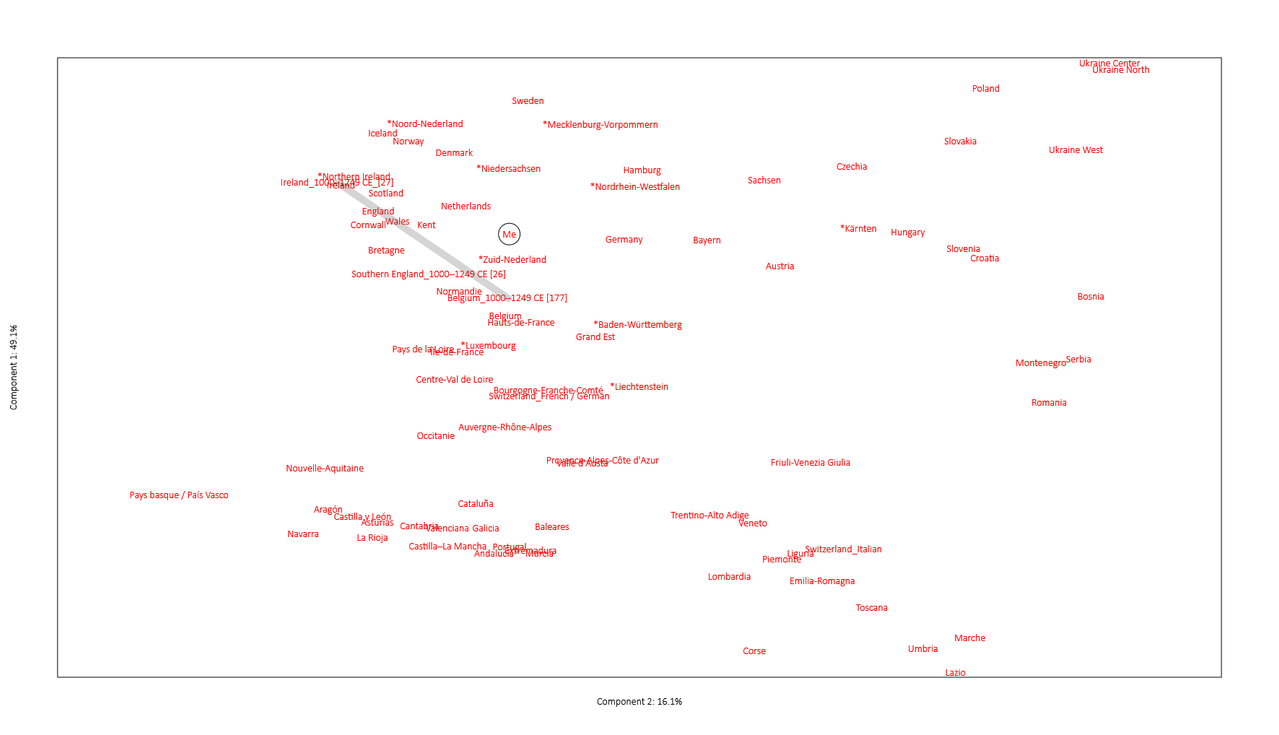
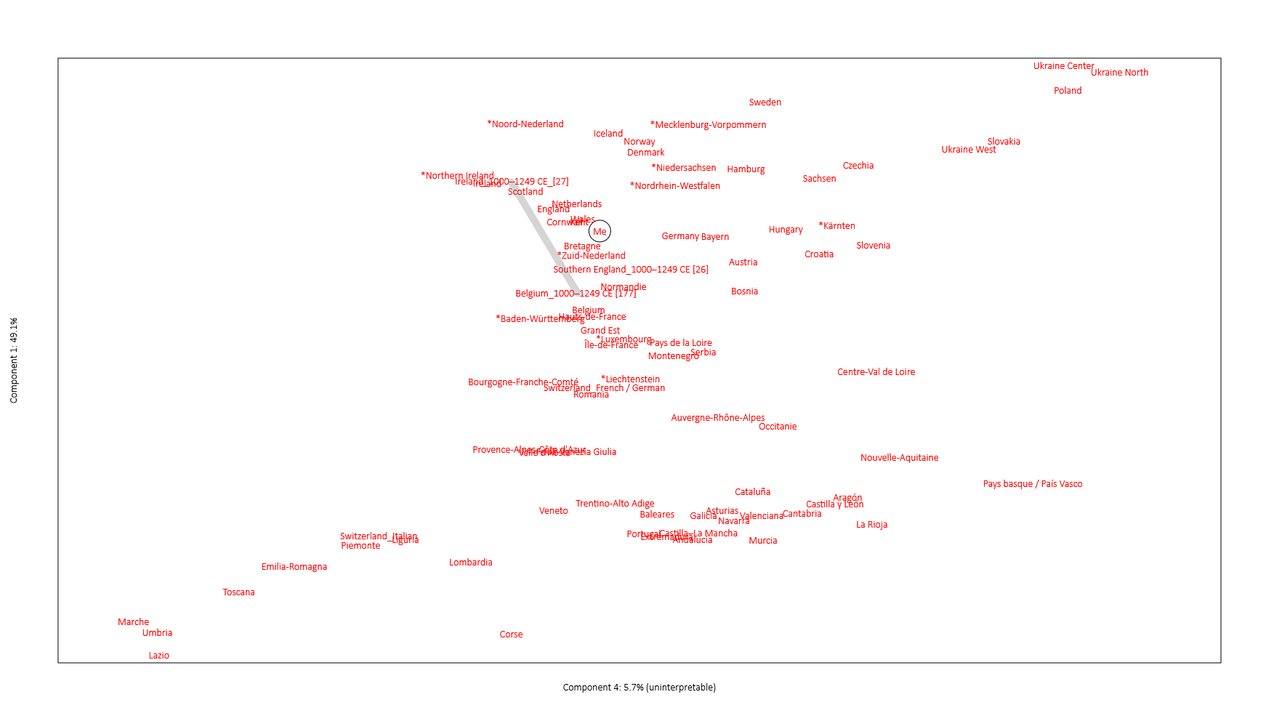
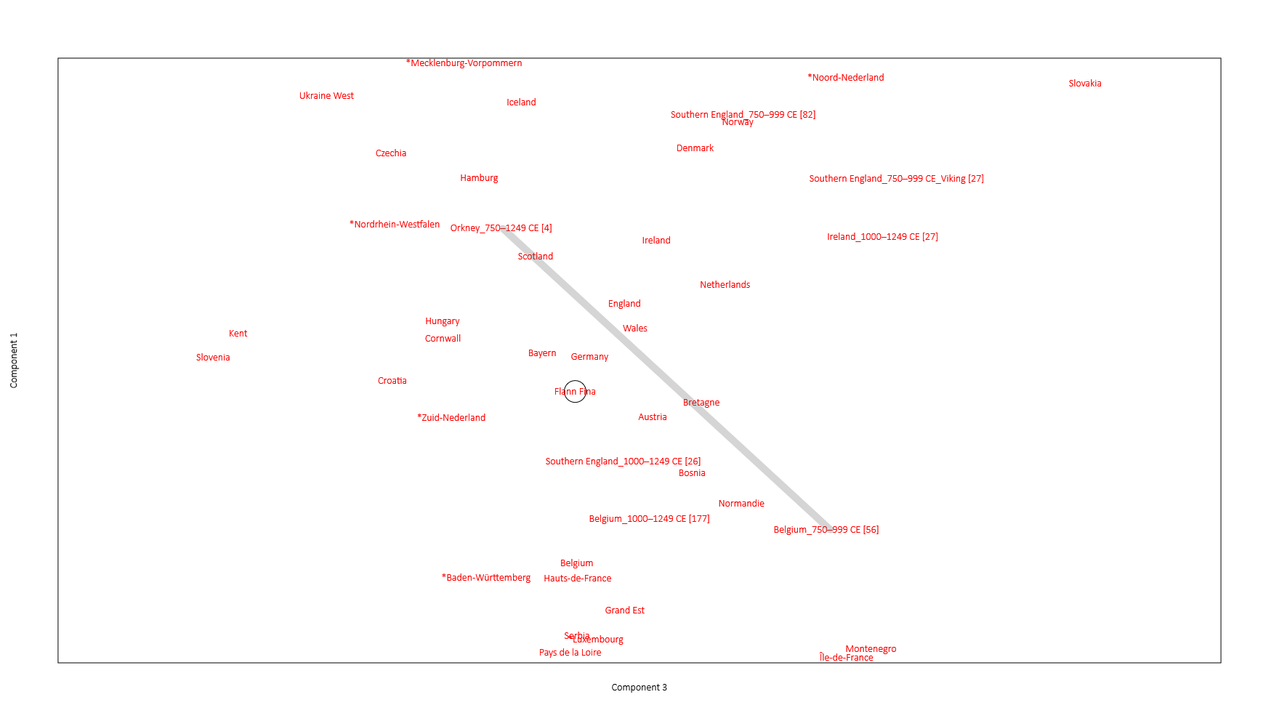
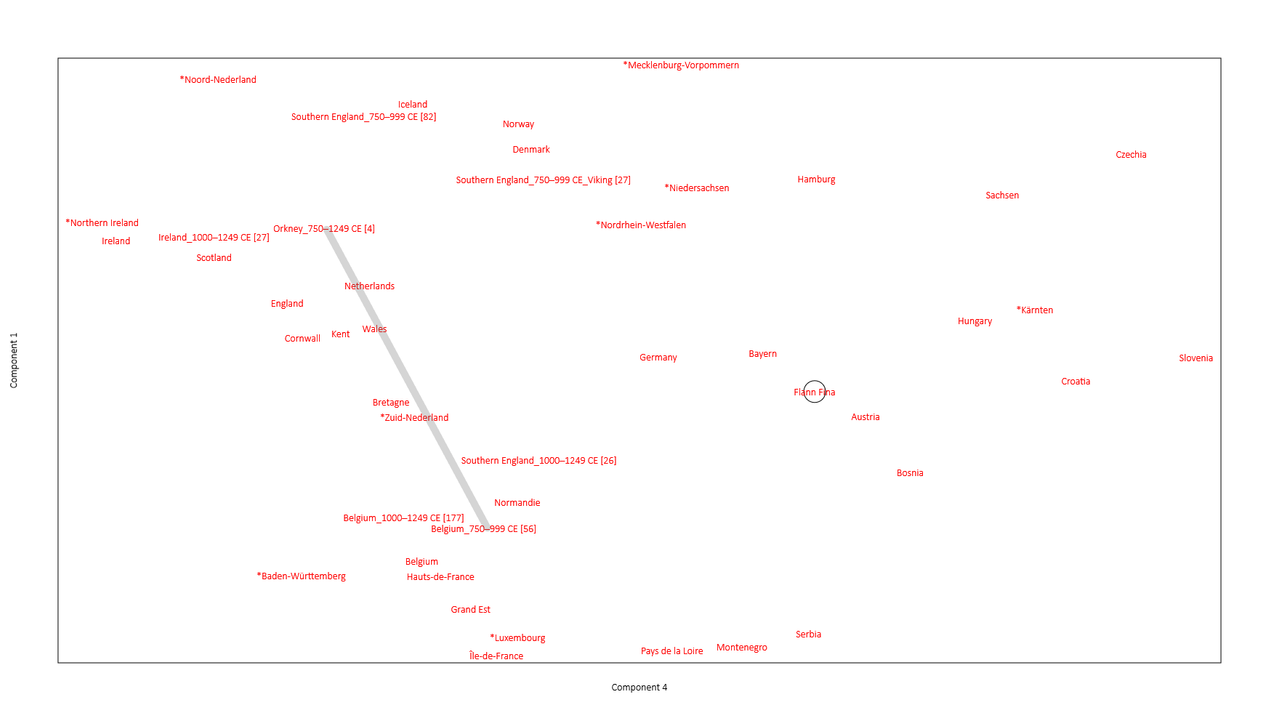
Lastly, a model of my own ancestry in PCA plot form...
 postimg.cc
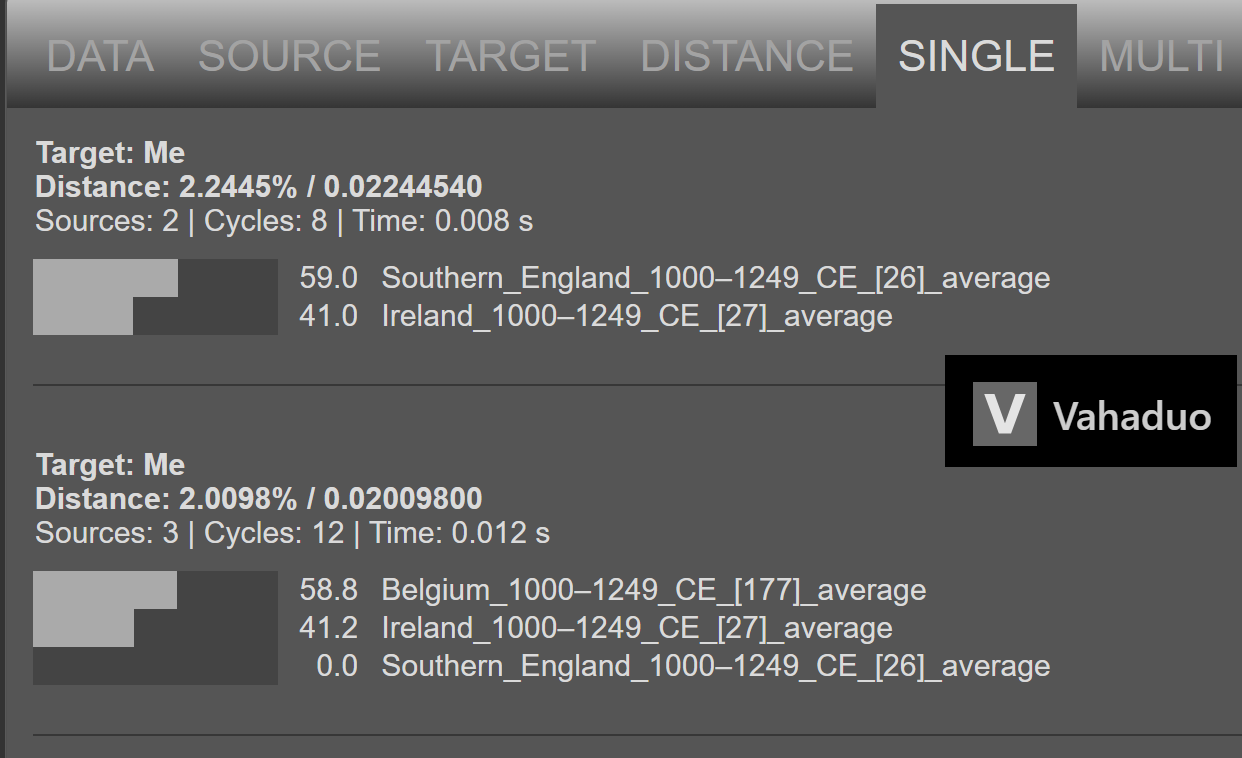
...and in Vahaduo modelling form.
 postimg.cc
If anyone wants the scaled G25 coordinates of the averages, here they are:
Thanks for reading.")
I made a few PCA plots using Eurogenes Global 25 data. Hopefully the plots are self-explanatory, but I added some comments to each plot as guidance. All PCA plots display PC 1 vs. PC 2. None of the other PCs reached significance on the scree plot.
First, a map of the study area, namely Southern England (SW England, SE England, London, East Anglia).
English regions 2009 — Postimages
Next, a time transect in PCA plot form of samples from Southern England. I perhaps should have made it clearer that the "Viking" label applies to the CE batch, not the BCE batch that occupies the same position.
Next, UMAP plots from Genetic history of Cambridgeshire before and after the Black Death (2024), annotated by myself.
sciadv adi5903 f2 — Postimages
Next, the same time transect as before, but drawing a parallel to the "professional" UMAP plot.
Next, my LivingDNA results, to support my ancestry being correct.
Living DNA results — Postimages
Next, a time transect of Belgium and a comment on Normans.
Next, using Medieval Belgium as a proxy for the new ancestry source in Medieval England, in PCA plot form...
...and in Vahaduo modelling form.
Lastly, a model of my own ancestry in PCA plot form...
My model PCA plot — Postimages
...and in Vahaduo modelling form.
My model Vahaduo — Postimages
If anyone wants the scaled G25 coordinates of the averages, here they are:
Code:
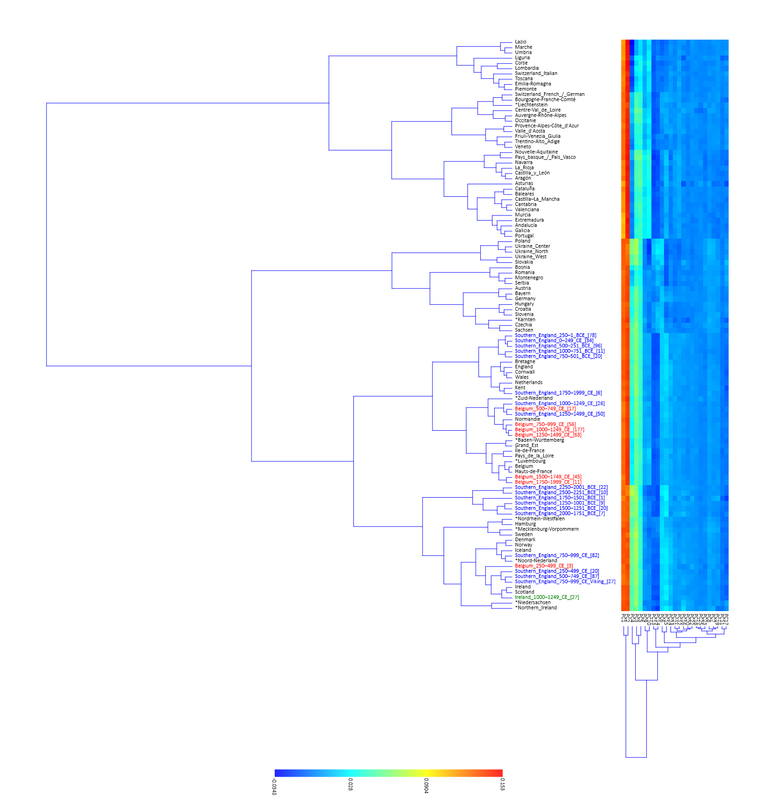
Southern_England_1000–1249_CE_[26]_average,0.1224036154,0.136979346,0.0576125,0.036474154,0.040906962,0.013418846,0.001039423,0.005502731,0.009274346,0.009791654,-0.004284538,0.005896615,-0.012247308,-0.010263538,0.016046269,0.004451846,-0.006975615,0.000843,0.001919269,0.002308769,0.005912577,0.002064038,-0.002185269,0.008508885,-0.000515808
Belgium_1000–1249_CE_[177]_average,0.1242665085,0.1378193729,0.0523238362,0.0314879379,0.0392336384,0.0105048814,0.0028293107,0.0057911695,0.0074830452,0.0090222034,-0.0041587966,0.0054146610,-0.0116005537,-0.0086850056,0.0137154181,0.0033761469,-0.0056337401,0.0015224011,0.0033710960,0.0017211469,0.0034085254,0.0028342034,-0.0002631977,0.0082931751,-0.0005554124
Ireland_1000–1249_CE_[27]_average,0.1298848148,0.1331847778,0.0611774444,0.0503999630,0.0371122593,0.0189129259,0.0020453704,0.0051793333,0.0034616667,0.0022947407,-0.0066698889,0.0059002963,-0.0148219259,-0.0166115185,0.0251534815,0.0087264815,-0.0081997407,0.0020457778,0.0032215556,0.0052941852,0.0044551481,0.0037508519,0.0010224074,0.0098183333,-0.0001109259
Southern_England_750–999_CE_[82]_average,0.1312991098,0.1338641220,0.0666491829,0.0564265244,0.0418651585,0.0207501585,0.0050840854,0.0060898171,0.0020152927,-0.0011156463,-0.0046656463,0.0053220732,-0.0111350732,-0.0103888415,0.0236781829,0.0079521829,-0.0087102683,0.0030636707,0.0044853049,0.0047034756,0.0072600488,0.0042207927,-0.0001412561,0.0149020244,-0.0001708415
Belgium_750–999_CE_[56]_average,0.1247582500,0.1382751964,0.0534434107,0.0303100893,0.0403426429,0.0099803214,0.0020143036,0.0041124464,0.0077609464,0.0094046607,-0.0030738393,0.0059919643,-0.0109398036,-0.0090953929,0.0130533929,0.0051922679,-0.0023236250,0.0015633036,0.0044263750,0.0024565000,0.0023685893,0.0029433393,0.0006381964,0.0092847143,-0.0012958214
Thanks for reading.
")