PCA's are PCA's and give us rough proximities or distances (the lightest components, absent, have also something to tell us, erased in PCA).
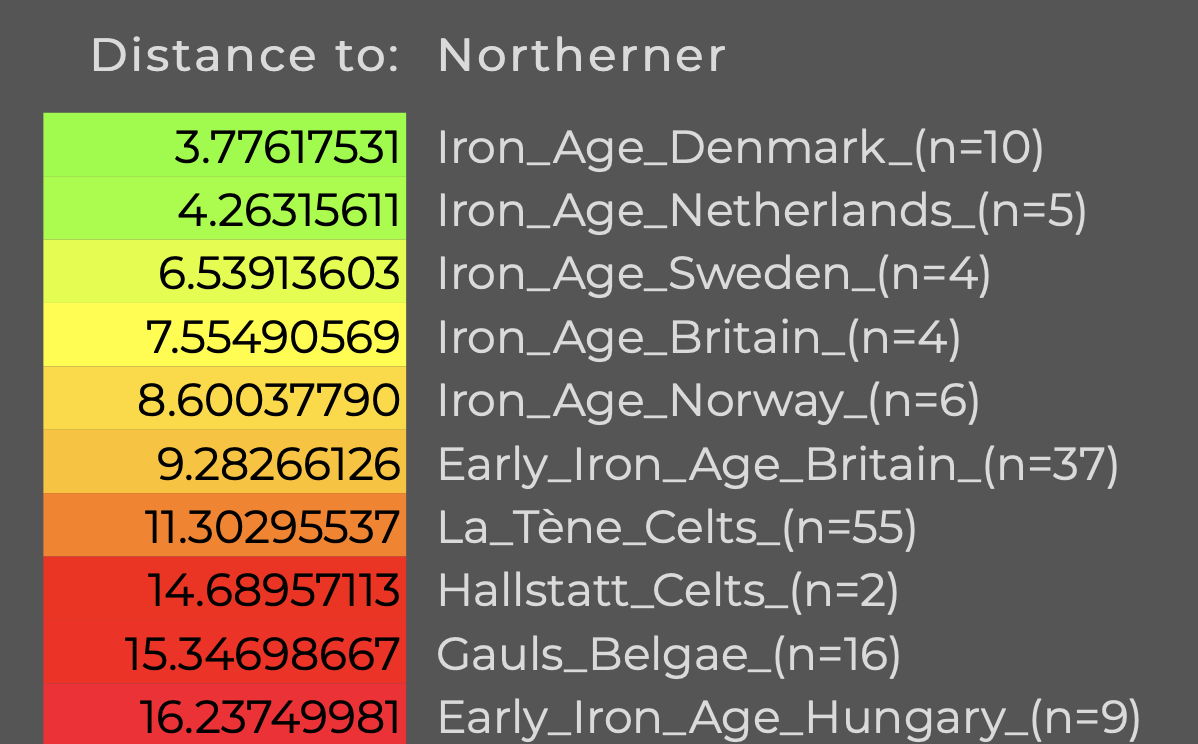
My first reading of your post was you doubted of the relative proximity of average Belgians and ancient continental Celts.
My answer at first covered the different regions around where different inputs occurred later in History: in quantity and in quality.
Whatever Germanic, Slavic, or Germanic+Slavic and even more southern, according not only to country (state) but also to region, these later inputs can easily explain the today distanciation between the ancient inhabitants of these ancient continental Celtic or proto-Celtic regions and their today inhabitants. Austria is central Europe for me, and, irrigated by the Danube (a highway!), its today position on PCA's has nothing surprising (it has never been a Celtic stronghold). Concerning Slavs, yes, surely they played some role in the game. Particularly in Czechia, less in Bavaria or Austria. To me, Swiss like southern France are shifted "southwards" rather than "eastwards", to speak like that. I don't speak about the more eastern territories less succesfully occupied, some time ago, by the Celts. Their footprint was already light.