One probable cause of the increase and decay of haplogroups frequencies?

gidai

Banned
Messages
376
Reaction score
48
Points
0
I try to see what happens if at one point in time, two diferent populations, each with its own Y haplogruop, 1 and 2, mix together, let's say in proportion of 1 to 99. At the initial moment the Y haplogroup 1 population represent only 1% of the mixture, and fertility is the same for both populations, but because of any biological reasons there is a difference between the number of boys and girls who are born in families of men of haplogrup 1 and 2. I assumed that from 10 offsprings, males 1 have 6 boys and 4 girls, and males 2 have 4 boys and 6 girls.
Then I calculated what would happen with the frequency of this two haplogroups in the mixed population over the next generations. Their evolution is spectacular.

1(%) ... 2(%)

1 .........99 --> initial
1,49.....98,51
2,22.....97,78
3,3.......96.7
4,86.....95,14
7,12.....92.88
10,32....89,68
14,72....85,28
20,56....79,44
27,97....72,03
36,81....63,19
46,63....53,37
56,72....43,28 --> XII generation (300 - 360 years)
66,28....33,72
74,68....25,32
81,56....18,44
86,9.....13,1
90,87.... 9,13 --> XVII generation (425 - 510 years)
93,72.... 6,28
95,73.... 4,27
97,11.... 2,89
98.05.... 1,95
98,69.... 1,31
99,13.... 0,87 --> XXIII
generation (575 - 690 years)
99,42.... 0,58
99,61.... 0,39


Since the XII generation (300-360 years), the haplogroups proportion has changed in favor of Y haplogroup 1.
In the
XXIII generation (575 - 690 years) haplogroup 2 is already below 1%.

Other important effects:
a) - Mitochondrial haplogroup of the population 2, which represented 99% at the beginning, will increase, reaching
almost 100% in a verry short time.
b) - Although haplogroup 1 has become overwhelming, in fact the initial autosomal genetic heritage proportion of the mixture is kept, 1 to 99.
c) - This may explain the success of the new branches of haplogroups, some of which spread very rapidly against the oldest one or his own basal branches, that were widespread before. Otherwise their chances of spreading would be virtually non-existent...

If it has a correspondent in reality, among other things this can explain the so call "sudden population extinctions" if we take into account only the chromosome Y. But these extinctions do not exist autosomaly!
I think it be one explainations of the fast expansion at high proportion of R1b, R1a, or other Y haplogroups.
So, probably, mixing with other small groups, many populations like Neolithic Farmers switch Y chromosome, but their genetic heritage remain at high level until today.

What do you think? :wary2:
 
Last edited:
Theres no evidence of hg I2 and G had the same population as R1b, in my view from early on R1b had higher population percentage and other factors could have even more further their cause too. In ancient times Europe had less population and only after bronze age the population grew so from bronze age whichever hg were dominant form todays dominant group.
 
Let say if today EEF's ydna contribution is 10% and their adna contribution is half of population its because their specific mutations had positive impact so were selected more and more(evolution) so it should'nt be taken as more mtdna contribution.
 
Theres no evidence of hg I2 and G had the same population as R1b, in my view from early on R1b had higher population percentage

There is no evidence of the contrary, either. Actually, I'd say that some of the regions that before the Bronze Age had a much higher presence of I2 and G2a (as well as other minor haplogroups like T1) are supposed by archaeologists to have had a much higher population density than the pre-Bronze Age Pontic-Caspian steppe, where the vast majority of ancient R1b-M269 (which is virtually the entire R1b frequency in modern Europe) has been found. For example, all of Southeastern Europe is thought to have had a higher population density than the rest of Europe, and at least as of now the frequency of R1b-M269 there before the Bronze Age population movements is negligible.
 
I think that is possibly one among the several reasons for the decay of some haplogroups and expansion of others, but I think we should try to find first at least some tangent scientific evidence pointing out to some relationship between Y-DNA haplogroup and hormonal/chemical influences on the determination of the sex of the foetus. Does anyone know if such a thing is investigated by scientists anywhere?

That said, I must say my personal opinion is that the main factor is indeed social (more precisely sociocultural + political), not biological differences between haplogroups and people who carry them. I only find exception in some quite random things related to genetic drift, differentiation by isolation, founder effects and genetic bottlenecks, all of those processes which are not related to some specific, inner advantage of some haplogroup over another.

In my opinion, the genetic, archaeological and anthropological evidence - including the comparison with much more recent and therefore much more well known processes of population turnover (as in the Americas with both Native Americans and Africans) - indicate to the hard truth that the ascendancy of some haplogroups over others have more to do with heavily skewed prospects of marriage, property, status and freedom along ethnic, phenotypic ("racial") or even strict class (e.g. caste, exclusive serfdom or slavery of a people by another) lines. In some cases, the shift was just too rapid to have been completely natural, for instance. In others, there is evidence of parallel differentiation in family/social fate for males of different backgrounds.

Due to the very cumulative/exponential nature of the expansion of haplogroups (but that can also happen even with genome-wide auDNA as we could see recently in the Early vs. Present-day Iceland paper), that kind of change doesn't even require some awful genocide or absurdly inhumane totalitarianism to happen, as seems to be the belief of some people who seem unable to accept this fact as one of the main reasons for the expansion of some Y-DNA haplogroups.

Even a small but definite and prolonged advantage over a conquered people that retains a lower (formal or informal) status in society can engender a huge change in the long term (and that's simply assuming that the conquerors were generally not monsters, no deliberate ethnic cleansing, no genocide, no deathly displacements and trail of tears etc. - which we know have happened frequently even in our modern, "civilized" times). For example in this hypothetical scenario:

1 - 1000 AD
Conqueror group: 15% of the males initially
Defeated group: 85% of the males initially
Conqueror group: birth rate 45.50 per 1,000 / death rate 43.80 per 1,000 (for the male cohort of the population)
Defeated group: birth rate 44.40 per 1,000 (just -2.4% lower) / death rate 44.40 per 1,000 (just +1.4% higher).
"Conqueror" growth (overlooking any later immigration): 0.17%
"Defeated" growth: 0%

After 1000 years: "Conqueror" male lineages add up to nearly 50% of the total.

But that's a very moderate, "humane" scenario, where the more dominant "caste" just gets to breed a little bit more and die young a little less often than the rest of the population. Now imagine a much more extreme scenario (not just of slaughters and tolls in warfare, but of sheer loss of property and clout by the native males), at least in the initial phase of the change in ethnic/cultural and political dominance, and you may have a much more dramatic scenario in the long term. I don't think it's unlikely at all.
 
I think that is possibly one among the several reasons for the decay of some haplogroups and expansion of others (...)
My knowledge in genetics is very limited, but I found it to be one of the scenarios that can explain some points uncleared yet.
I beleave as you say, "That kind of change does not even require an awful genocide or absurdly inhumane totalitarianism to happen, as seems to be the belief of some people who seem unable to accept this fact as one of the main reasons for the expansion of some Y-DNA haplogroups"
 
There is no evidence of the contrary, either. Actually, I'd say that some of the regions that before the Bronze Age had a much higher presence of I2 and G2a (as well as other minor haplogroups like T1) are supposed by archaeologists to have had a much higher population density than the pre-Bronze Age Pontic-Caspian steppe, where the vast majority of ancient R1b-M269 (which is virtually the entire R1b frequency in modern Europe) has been found. For example, all of Southeastern Europe is thought to have had a higher population density than the rest of Europe, and at least as of now the frequency of R1b-M269 there before the Bronze Age population movements is negligible.

Yes your theory is correct among others, so if R1b and invaded people were half the population each in the beginning then your upper caste scenario at works do get R1b folks from half of population to 80%+. so people should stop worrying about this issue anymore!
 
I try to see what happens if at one point in time, two diferent populations, each with its own Y haplogruop, 1 and 2, mix together, let's say in proportion of 1 to 99. At the initial moment the Y haplogroup 1 population represent only 1% of the mixture, and fertility is the same for both populations, but because of any biological reasons there is a difference between the number of boys and girls who are born in families of men of haplogrup 1 and 2. I assumed that from 10 offsprings, males 1 have 6 boys and 4 girls, and males 2 have 4 boys and 6 girls.
Then I calculated what would happen with the frequency of this two haplogroups in the mixed population over the next generations. Their evolution is spectacular.

1(%) ... 2(%)

1 .........99 --> initial
1,49.....98,51
2,22.....97,78
3,3.......96.7
4,86.....95,14
7,12.....92.88
10,32....89,68
14,72....85,28
20,56....79,44
27,97....72,03
36,81....63,19
46,63....53,37
56,72....43,28 --> XII generation (300 - 360 years)
66,28....33,72
74,68....25,32
81,56....18,44
86,9.....13,1
90,87.... 9,13 --> XVII generation (425 - 510 years)
93,72.... 6,28
95,73.... 4,27
97,11.... 2,89
98.05.... 1,95
98,69.... 1,31
99,13.... 0,87 --> XXIII
generation (575 - 690 years)
99,42.... 0,58
99,61.... 0,39


Since the XII generation (300-360 years), the haplogroups proportion has changed in favor of Y haplogroup 1.
In the
XXIII generation (575 - 690 years) haplogroup 2 is already below 1%.

Other important effects:
a) - Mitochondrial haplogroup of the population 2, which represented 99% at the beginning, will increase, reaching
almost 100% in a verry short time.
b) - Although haplogroup 1 has become overwhelming, in fact the initial autosomal genetic heritage proportion of the mixture is kept, 1 to 99.
c) - This may explain the success of the new branches of haplogroups, some of which spread very rapidly against the oldest one or his own basal branches, that were widespread before. Otherwise their chances of spreading would be virtually non-existent...

If it has a correspondent in reality, among other things this can explain the so call "sudden population extinctions" if we take into account only the chromosome Y. But these extinctions do not exist autosomaly!
I think it be one explainations of the fast expansion at high proportion of R1b, R1a, or other Y haplogroups.
So, probably, mixing with other small groups, many populations like Neolithic Farmers switch Y chromosome, but their genetic heritage remain at high level until today.

What do you think?
:wary2:/QUOTE]


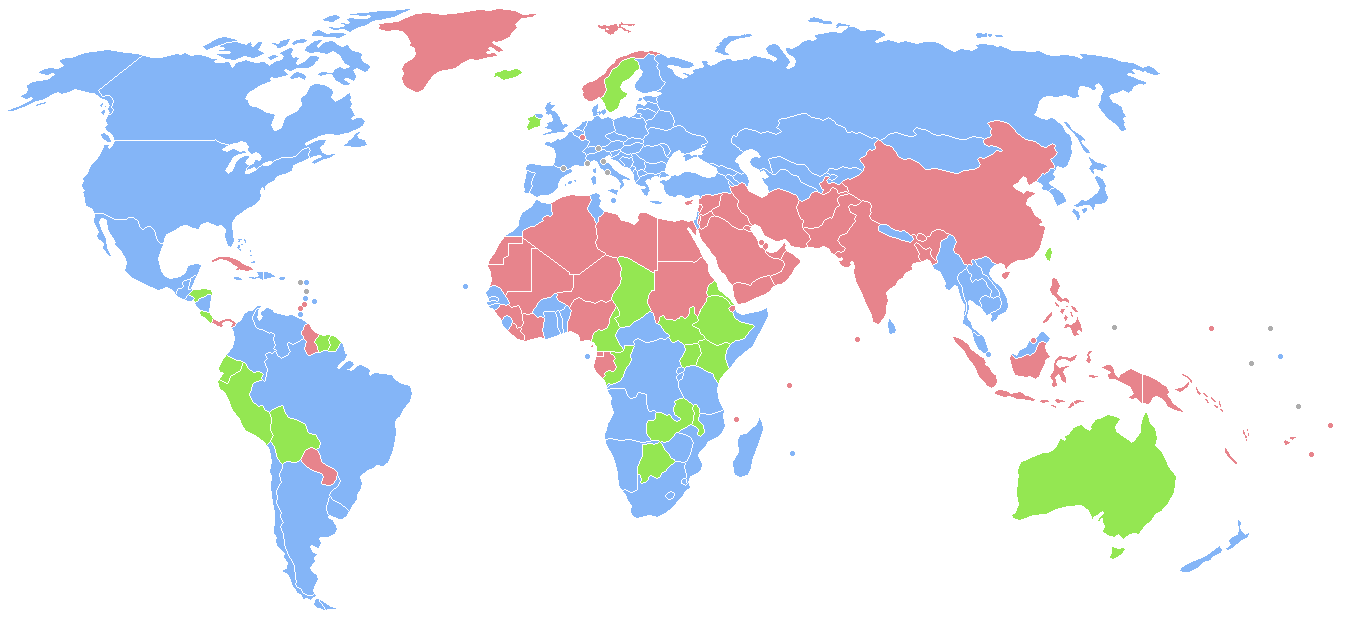
I found something interesting, and I believe this validates what I was saying at first.
Red represent areas where more boys are born.
China is a bit influenced by the demographic policy taken there, but look at the rest, like the Caucasus and even the Western Balkans. South Asia, Pakistan, Afganistan, Irak, Iran or Kazakhstan - Central Asia. I think, YDNA clade from the most redish areas are putting pressure on the yellow and green around them. passing around.
Any idea is welcome. What do you think?
https://upload.wikimedia.org/wikipedia/commons/a/ac/2012_Birth_Sex_Ratio_World_Map.jpg
2012_Birth_Sex_Ratio_World_Map.jpg


Additional map.
Sex ratio in total living population. (Red means more men. Mature men. Anyway they are fertile to old age :rolleyes:)
Sex_ratio_total_population_gbbr.gif

I think that there are some matches with the places where new mutations on the Y chromosome are thought to have spread further in Eurasia.
 
Last edited:
Let's look only at the warm, reddish areas on the first map, centered on the Western Balkans around Albania - Montenegro (sex ratio 1,08), exactly where the percentages of new branches of I2, J2 and E grow probably in the last 2000-3000 years, now spreading more and more in the rest of Europe.
https://upload.wikimedia.org/wikipedia/commons/a/ac/2012_Birth_Sex_Ratio_World_Map.jpg

Maybe it is not just a founder effect, which appears exactly in the area with the highest boys' birth rate in Europe!?
 
Last edited:

This thread has been viewed 9555 times.

Back
Top