I hope I did not get wrong in the calculations. I have selected the percentages in the Balkan countries from here. https://www.eupedia.com/europe/european_y-dna_haplogroups.shtml
Then, using the latest data for the population of the Balkan countries, I calculated the number of YDNA carriers for each country and the proportions for the whole Balkan region. The number of carriers for each country is interesting I think. The results are in the second table.
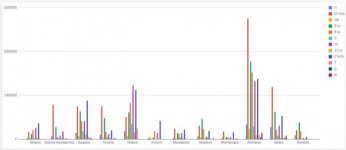
Chart of the number of carriers/country.

Then, using the latest data for the population of the Balkan countries, I calculated the number of YDNA carriers for each country and the proportions for the whole Balkan region. The number of carriers for each country is interesting I think. The results are in the second table.
| Percentages | |||||||||||||
| Region/Haplogroup ▾ | I1 | I2*/I2a | I2b | R1a | R1b | G | J2 | J*/J1 | E1b1b | T | Q | N | Population 2018 |
| Albania | 2 | 12 | 1.5 | 9 | 16 | 1.5 | 19.5 | 2 | 27.5 | 1 | 0 | 0 | 2668022 |
| Bosnia-Herzegovina | 4.5 | 50.5 | 0 | 18 | 3.5 | 1.5 | 5.5 | 1 | 11.5 | 0.5 | 0.5 | 1 | 3115982 |
| Bulgaria | 4 | 20 | 2 | 17 | 11 | 5 | 11 | 3 | 23.5 | 1.5 | 0.5 | 0.5 | 7519995 |
| Croatia | 5.5 | 37 | 1 | 24 | 8.5 | 2.5 | 6 | 1 | 10 | 0.5 | 1 | 0.5 | 4109669 |
| Greece | 3.5 | 9.5 | 1.5 | 11.5 | 15.5 | 6.5 | 23 | 3 | 21 | 4.5 | 0 | 0 | 10713748 |
| Kosovo | 5.5 | 2.5 | 0 | 4.5 | 21 | 0 | 16.5 | 0 | 47.5 | 0 | 0 | 0 | 1777604 |
| Macedonia | 3 | 23 | 1.5 | 13.5 | 12.5 | 4 | 14 | 2 | 21.5 | 1.5 | 0.5 | 0.5 | 2071278 |
| Moldova | 5 | 21 | 3 | 30.5 | 16 | 1 | 4 | 4 | 13 | 1 | 0 | 1.5 | 2998235 |
| Montenegro | 6 | 29.5 | 1.5 | 7.5 | 9.5 | 2.5 | 9 | 0.5 | 27 | 0 | 2 | 1.5 | 1206218 |
| Romania | 3.5 | 28 | 2.5 | 18 | 15.5 | 3 | 13.5 | 1 | 14 | 1 | 0.5 | 1.5 | 19706134 |
| Serbia | 8 | 34 | 0.5 | 18 | 6 | 2.5 | 9 | 1 | 15 | 0.5 | 1 | 2.5 | 7016127 |
| Slovenia | 9 | 20.5 | 1.5 | 38 | 18 | 1.5 | 2.5 | 0 | 5 | 1 | 0 | 0 | 2046818 |
| Total | 64949830 | ||||||||||||
| Numerical | |||||||||||||
| Region/Haplogroup ▾ | I1 | I2*/I2a | I2b | R1a | R1b | G | J2 | J*/J1 | E1b1b | T | Q | N | |
| Albania | 26680 | 160081 | 20010 | 120060 | 213441 | 20010 | 260132 | 26680 | 366853 | 13340 | 0 | 0 | |
| Bosnia-Herzegovina | 70109 | 786785 | 0 | 280438 | 54529 | 23369 | 85689 | 15579 | 179168 | 7789 | 7789 | 15579 | |
| Bulgaria | 150399 | 751999 | 75199 | 639199 | 413599 | 187999 | 413599 | 112799 | 883599 | 56399 | 18799 | 18799 | |
| Croatia | 113015 | 760288 | 20548 | 493160 | 174660 | 51370 | 123290 | 20548 | 205483 | 10274 | 20548 | 10274 | |
| Greece | 187490 | 508903 | 80353 | 616040 | 830315 | 348196 | 1232081 | 160706 | 1124943 | 241059 | 0 | 0 | |
| Kosovo | 48884 | 22220 | 0 | 39996 | 186648 | 0 | 146652 | 0 | 422180 | 0 | 0 | 0 | |
| Macedonia | 31069 | 238196 | 15534 | 139811 | 129454 | 41425 | 144989 | 20712 | 222662 | 15534 | 5178 | 5178 | |
| Moldova | 74955 | 314814 | 44973 | 457230 | 239858 | 14991 | 59964 | 59964 | 194885 | 14991 | 0 | 22486 | |
| Montenegro | 36186 | 177917 | 9046 | 45233 | 57295 | 15077 | 54279 | 3015 | 162839 | 0 | 12062 | 9046 | |
| Romania | 344857 | 2758858 | 246326 | 1773552 | 1527225 | 295592 | 1330164 | 98530 | 1379429 | 98530 | 49265 | 147796 | |
| Serbia | 280645 | 1192741 | 17540 | 631451 | 210483 | 87701 | 315725 | 35080 | 526209 | 17540 | 35080 | 87701 | |
| Slovenia | 92106 | 209798 | 15351 | 388895 | 184213 | 15351 | 25585 | 0 | 51170 | 10234 | 0 | 0 | |
| TOTAL number | 1456395 | 7882600 | 544880 | 5625065 | 4221720 | 1101081 | 4192149 | 553613 | 5719420 | 485690 | 148721 | 316859 | |
| % from TOTAL | 4.51 | 24.44 | 1.68 | 17.44 | 13.09 | 3.41 | 12.99 | 1.71 | 17.73 | 1.5 | 0.46 | 0.98 | |
| 32248193 Balkans men |
Chart of the number of carriers/country.

Last edited:

