Jovialis
Advisor
- Messages
- 9,313
- Reaction score
- 5,876
- Points
- 113
- Ethnic group
- Italian
- Y-DNA haplogroup
- R-PF7566 (R-Y227216)
- mtDNA haplogroup
- H6a1b7
Below are my eurogenes K36 Ancient results.
Oracle Calculator by www.dnagenics.com
v1 Beta 30/03/2019
Finished reading population data. 474 populations found.
36 components mode.
--------------------------------
Mixed Mode:
Elapsed Time: 75284 ms
1 52.54% CL38_GreeksouthItalian + 47.46% SZ19_Italian_Balkan @ 5.690
2 50.20% SZ19_Italian_Balkan + 49.80% CL38_GreeksouthItalian @ 5.720
3 60.74% CL38_GreeksouthItalian + 39.26% CL36_northItalian @ 6.226
4 68.55% CL38_GreeksouthItalian + 31.45% BA_I9041_Mycenaean @ 6.552
5 74.41% CL38_GreeksouthItalian + 25.59% CL94_Iberian @ 6.604
6 65.43% CL121__northItalian + 34.57% CHL_Anatolian_I1584 @ 6.687
7 76.37% CL38_GreeksouthItalian + 23.63% I1979_Beaker_North_Italy @ 6.703
8 78.71% CL38_GreeksouthItalian + 21.29% BA_Hungary_RISE374 @ 6.713
9 50.20% CL36_northItalian + 49.80% CL38_GreeksouthItalian @ 6.747
10 53.71% SZ19_Italian_Balkan + 46.29% CL30_GreeksouthItalian @ 6.752
11 77.54% CL38_GreeksouthItalian + 22.46% BA_Hungary_RISE247 @ 6.754
12 50.20% CL30_GreeksouthItalian + 49.80% SZ19_Italian_Balkan @ 6.813
13 75.98% CL38_GreeksouthItalian + 24.02% BA_Hungary_RISE483 @ 6.844
14 55.66% SZ19_Italian_Balkan + 44.34% EMA_GreekBalkan_AEH_1 @ 7.140
15 78.71% SZ19_Italian_Balkan + 21.29% CHL_Iran_I1665 @ 7.187
16 61.13% CL38_GreeksouthItalian + 38.87% SZ40_Italian @ 7.195
17 50.20% EMA_GreekBalkan_AEH_1 + 49.80% SZ19_Italian_Balkan @ 7.267
18 78.71% SZ19_Italian_Balkan + 21.29% CHL_Iran_I1674 @ 7.290
19 67.38% CL121__northItalian + 32.62% EN_Anatolia_Tep003 @ 7.335
20 77.54% SZ19_Italian_Balkan + 22.46% MBA_Armenia_RISE423 @ 7.377
21 78.71% SZ19_Italian_Balkan + 21.29% CHL_Iran_I1662 @ 7.389
22 81.45% CL38_GreeksouthItalian + 18.55% MN_Germany_I0807 @ 7.433
23 63.87% CL38_GreeksouthItalian + 36.13% SZ36_northItalian @ 7.484
24 54.49% CL38_GreeksouthItalian + 45.51% CL121__northItalian @ 7.495
25 83.40% CL38_GreeksouthItalian + 16.60% N_Germany_I0048 @ 7.497
26 74.41% CL30_GreeksouthItalian + 25.59% BA_Hungary_RISE374 @ 7.539
27 50.20% CL121__northItalian + 49.80% CL38_GreeksouthItalian @ 7.552
28 50.20% SZ40_Italian + 49.80% CL38_GreeksouthItalian @ 7.631
29 79.49% SZ19_Italian_Balkan + 20.51% IA_LevantEgypt_Gladiator_3DRIF26 @ 7.653
30 77.93% CL38_GreeksouthItalian + 22.07% BA_Hungary_RISE480 @ 7.720
31 75.59% CL121__northItalian + 24.41% BA_I0070_Minoan @ 7.793
32 78.32% CL38_GreeksouthItalian + 21.68% EMA_northItalian_FN_2 @ 7.837
33 77.15% CL38_GreeksouthItalian + 22.85% i3757_Celtiberian_IA @ 7.849
34 82.23% CL38_GreeksouthItalian + 17.77% N_Hungary_NE7 @ 7.856
35 65.43% CL38_GreeksouthItalian + 34.57% BA_I9006_Mycenean @ 7.952
36 80.66% CL38_GreeksouthItalian + 19.34% MN_Germany_I0560 @ 7.955
37 78.71% CL38_GreeksouthItalian + 21.29% N_Sweden_Gokhem5 @ 8.012
38 73.24% CL38_GreeksouthItalian + 26.76% Visigoth_southEuro_mixed_I12031 @ 8.019
39 73.63% CL121__northItalian + 26.37% N_Levant__AinGhazal3 @ 8.022
40 82.62% CL38_GreeksouthItalian + 17.38% N_Hungary_CO1 @ 8.045
Least-squares method.
Using 1 populations approximation
1 100% CL38_GreeksouthItalian @ 11.394
2 100% SZ19_Italian_Balkan @ 12.345
3 100% CL121__northItalian @ 12.776
4 100% CL30_GreeksouthItalian @ 13.825
5 100% CL25_south_Italian @ 14.551
6 100% EMA_GreekBalkan_AEH_1 @ 14.554
7 100% SZ40_Italian @ 15.593
8 100% CL36_northItalian @ 15.918
9 100% SZ37_Greek_Italian @ 16.719
10 100% EN_Anatolia_Tepe002 @ 16.948
New populations: 98
Using 2 populations approximation
1 50% CL38_GreeksouthItalian + 50% SZ19_Italian_Balkan @ 5.716
2 50% CL36_northItalian + 50% CL38_GreeksouthItalian @ 6.729
3 50% CL30_GreeksouthItalian + 50% SZ19_Italian_Balkan @ 6.807
4 50% EMA_GreekBalkan_AEH_1 + 50% SZ19_Italian_Balkan @ 7.259
5 50% CL121__northItalian + 50% CL38_GreeksouthItalian @ 7.547
6 50% CL38_GreeksouthItalian + 50% SZ40_Italian @ 7.617
7 50% CL121__northItalian + 50% CL30_GreeksouthItalian @ 8.101
8 50% CL121__northItalian + 50% SZ19_Italian_Balkan @ 8.178
9 50% CL38_GreeksouthItalian + 50% SZ36_northItalian @ 8.189
10 50% CL30_GreeksouthItalian + 50% CL36_northItalian @ 8.199
Using 3 populations approximation
1 33% CL121__northItalian + 33% CL38_GreeksouthItalian + 33% SZ19_Italian_Balkan @ 4.480
2 33% CL38_GreeksouthItalian + 33% EMA_GreekBalkan_AEH_1 + 33% SZ19_Italian_Balkan @ 4.680
3 33% CL121__northItalian + 33% CL30_GreeksouthItalian + 33% SZ19_Italian_Balkan @ 4.815
4 33% BA_I9041_Mycenaean + 33% CL38_GreeksouthItalian + 33% EMA_GreekBalkan_AEH_1 @ 5.336
5 33% BA_I9006_Mycenean + 33% CL121__northItalian + 33% CL38_GreeksouthItalian @ 5.849
6 33% BA_I9033_Mycenaean + 33% CL121__northItalian + 33% CL38_GreeksouthItalian @ 5.854
7 33% BA_I9006_Mycenean + 33% CL38_GreeksouthItalian + 33% EMA_GreekBalkan_AEH_1 @ 5.863
8 33% CL36_northItalian + 33% CL38_GreeksouthItalian + 33% SZ19_Italian_Balkan @ 5.917
9 33% CL121__northItalian + 33% CL30_GreeksouthItalian + 33% EMA_Greek_STR_300 @ 5.965
10 33% CL121__northItalian + 33% CL38_GreeksouthItalian + 33% EMA_Greek_STR_300 @ 6.020
Using 4 populations approximation
1 25% CL121__northItalian + 25% CL30_GreeksouthItalian + 25% CL38_GreeksouthItalian + 25% SZ19_Italian_Balkan @ 4.447
2 25% CHL_Anatolian_I1584 + 25% CL121__northItalian + 25% EMA_GreekBalkan_AEH_1 + 25% SZ19_Italian_Balkan @ 4.656
3 25% CL38_GreeksouthItalian + 25% EMA_GreekBalkan_AEH_1 + 25% SZ19_Italian_Balkan + 25% SZ19_Italian_Balkan @ 4.672
4 25% CL36_northItalian + 25% CL38_GreeksouthItalian + 25% CL38_GreeksouthItalian + 25% SZ19_Italian_Balkan @ 4.683
5 25% CL121__northItalian + 25% CL38_GreeksouthItalian + 25% EMA_GreekBalkan_AEH_1 + 25% SZ19_Italian_Balkan @ 4.693
6 25% CL121__northItalian + 25% CL38_GreeksouthItalian + 25% CL38_GreeksouthItalian + 25% SZ19_Italian_Balkan @ 4.699
7 25% BA_I9041_Mycenaean + 25% CL38_GreeksouthItalian + 25% CL38_GreeksouthItalian + 25% EMA_GreekBalkan_AEH_1 @ 4.758
8 25% CL30_GreeksouthItalian + 25% CL36_northItalian + 25% CL38_GreeksouthItalian + 25% SZ19_Italian_Balkan @ 4.790
9 25% CHL_Anatolian_I1584 + 25% CL121__northItalian + 25% EMA_Greek_STR_300 + 25% EMA_GreekBalkan_AEH_1 @ 4.812
10 25% BA_I9041_Mycenaean + 25% CL121__northItalian + 25% CL38_GreeksouthItalian + 25% CL38_GreeksouthItalian @ 4.973
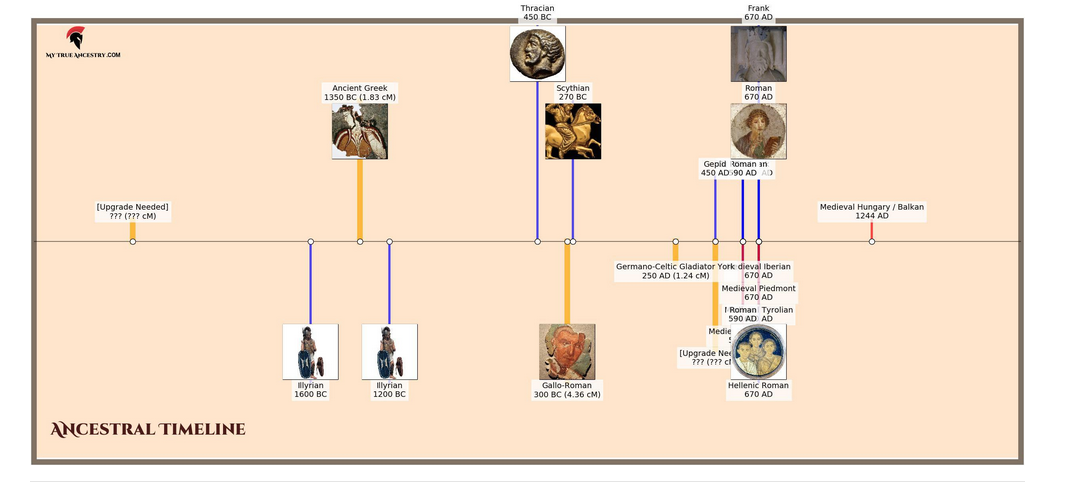
The raw data file was also created with their companion software, DNAkit studio. It is a combination of 23andme, AncestryDNA, Living DNA, and Helix Geno 2.0. It was made in DIYDodecad format, which is what the Admixturestudio kit converts the file to. So I guess that would give it optimal compatibility. This is the results for it in AncestryDNA format, on MyTrueAncestry:

I believe since this file has the most SNPs, it is the most legitimate representation. Living DNA may yield more results, but it is done, with genotyped information, on the least amount of SNPs. I read on a whole genome sequencing service, that there may still be some non-matching SNPs with raw data from a whole seqeunced genome, and a genotyped file from another consumer genomics service. The reason is because the lack of information in the file falsely assigns some results. My guess is that it is being overwriten with more fleshed out information, with the superkit. Because even when I compare the superkit to another raw data file that is baked into the superkit, there are non-matching SNPs. That means to me, that they're being changed.


")