Torzio: This is your Geno Report. Have they updated your results. My report looks different. When did you do Geno. I just did it In December and there Sample size is now > 1 Million. The Tuscan Reference Sample % are much different now than what your report is showing. Here is what I got last month. It compares my 2 Reference Populations (Italy-Tuscany) and Greek (Not sure where in Greece) to my DNA. I would email them and ask them to provide you an update. Here is my report, sorry about the formatting but this is what mine looks like.
Your Regional Ancestry
(500 Years to 10,000 Years Ago)
We are all more than the sum of our parts, but the results below offer some of the most fascinating and newest information possible with your Geno 2.0 Next Generation test. In this section, we display your affiliations with a set of twenty-two world regions. This information is determined from your entire genome, so we’re able to see both parents’ information, going back six generations, or more. Your percentages reflect both recent influences and ancient genetic patterns in your DNA due to how groups migrated to and from different regions, mixing for hundreds or even thousands of years. Your ancestors may have also mixed with ancient, now extinct hominid cousins, like Neanderthals. If you or your parents have an admixed background, this pattern can get complicated very quickly! Use the reference population matches below to help understand your results.
Your Results
REGIONS CONTINENTS
Italy & Southern Europe 71%
West Mediterranean 14%
Asia Minor 8%
Northwestern Europe 7%
Italy & Southern Europe
The Iceman, Otzi, is a descendant from the first farmers to have arrived in the Italian peninsula, which may have harbored remnant hunter-gatherer populations during the Pleistocene who resettled Northern Europe with the glacier retreats. Today, this ancestry is a mixture of the earlier farmers arriving from the Middle East as well as migrants pushing south from Northern Europe, whose own ancestry threads back to Central Europe and beyond. Strong connections exist east to the Balkans and Southeastern Europe, making this portion of your DNA trans-Adriatic, and even trans-Mediterranean, one that reflects trade and political connections. Elements of this ancestry can be also found in Northern and Eastern Europe, and also south, across the Mediterranean to Libya and other regions of northern Africa, genetic remnants from when the Roman empire expanded its horizons south.
West Mediterranean
This region includes the Mediterranean coast of Spain, Southern France, parts of Italy, and Sardinia and Corsica. Sardinia is an island of scientific intrigue. Although it is approximately 460 kilometers away from Rome on the Italian mainland, it has been isolated from Italy and Central and Eastern Europe for much of human history. It was not populated during the ice age, as most of the continent was, rendering the islanders as possible descendants of the first farmers of Europe who arrived some 8,000 years ago. The subsequent isolation of islanders and the Western Mediterranean allowed the group to evolve as a unique European cluster, distinct from Italians. Yet, this cluster is found outside of the region as well, particularly in France and Iberia. Western Mediterranean ancestry is deeply fused with ancestry from the Iberian Peninsula, and to a lesser degree continental Italy.
Asia Minor
Asia Minor consists of modern-day Turkey, parts of Greece, Georgia, Armenia and the northern Middle East. This component of global DNA originated in Southwest Asia and along the shores of the Mediterranean and Black Seas some 30,000 years ago. Although this region of the world was home to a Homo erectus subspecies (H. erectus georgicus) and later to Neanderthals, the true ancestors to the Asia Minor DNA component were the Homo sapiens hunter-gatherers, some of which later developed the world’s earliest farming. But Asia Minor ancestry is complex, since it is at a crossroads of Europe, Asia and Africa, making it a well-traveled path for those leaving Africa, but also going east to west and back again. This prehistoric and historic “highway” possibly peaked during the period of the famous Silk Road, which traversed Asia Minor and established a connection between that region and Central Asia that still persists today. Furthermore, the historic expansion of Arabic speakers during the growth and spread of Islam brought Arabian and Middle Eastern groups to Asia Minor. This ancestry is in fact strongest in Turks from Iraq, Syria, and the Caucasus. And ethnic groups such as the Druze and Assyrians also have clear roots in Asia Minor, suggesting that their DNA is native to the region.
Northwestern Europe
This region of Northern Europe is a biogeographical composite of populations that include British, Scottish, Irish, Welsh, Northern French, Belgians, Dutch, Danish, and some Scandinavian and German groups. So, much more than an established historical population, it is a prehistorical region characterized early on by a long period of glaciation, with episodic habitation by hunter-gatherer groups migrating from the south and east. With the advent of agriculture and the spread of plant domestication some 8,000 to 6,000 years ago, the people of Northwestern Europe grew from the mix of the early settlers and new farmers. Over the last 4,000 years, the region became subdivided into the ethnic and political entities we now know. This biogeographical region is seen in many people of European ancestry, as well as most people living in the U.S., Canada and Australia today. It is also seen in small percentages in groups from Latin America, as well as in countries that were part of the British Empire of the 18th and 19th centuries.
What Your Results Mean
We are all more than just the sum of our parts, but the regional percentages below offer some of the most fascinating information in your Geno test. In this section, we display your affiliations based on a set of twenty-two world regions. This information is captured from points across your entire genome, so we’re able to see both parents’ information going back six generations or more. Your percentages reflect mostly recent influences, yet they may also show some ancient patterns in your DNA due to mixing of groups from different regions over hundreds, if not thousands, of years. If you have a very mixed background, the pattern can get complicated quickly. Use the reference population matches below to help understand your unique results.
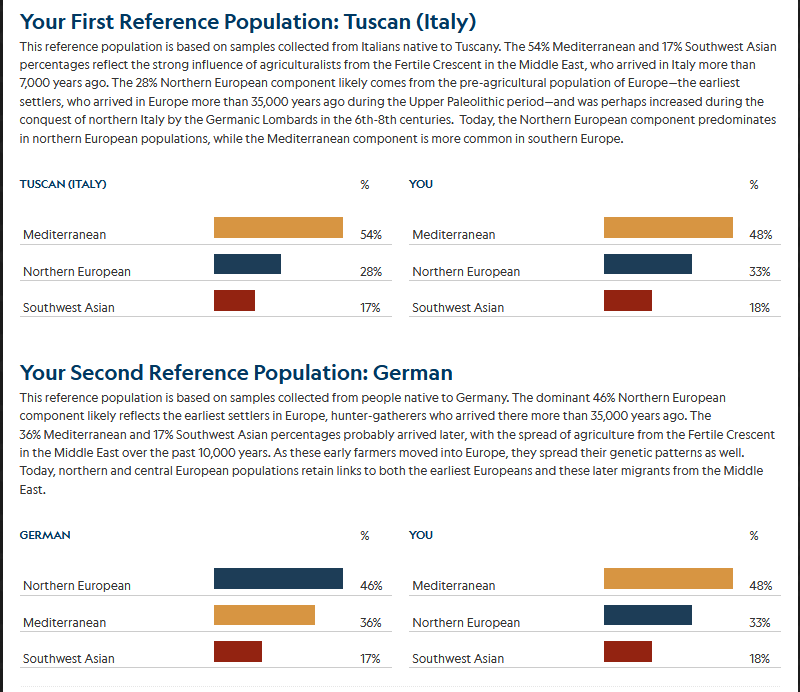
Your First Reference Population: Tuscan (Italy)
This reference population is based on Italians native to Tuscany, in north central Italy. The Southern and Central European percentages reflect the strong influence of agriculturalists from the Fertile Crescent in the Middle East, who arrived in Italy more than 7,000 years ago. The Eastern European component likely comes from the pre-agricultural population of Europe—the earliest settlers, who arrived in Europe more than 30,000 years ago during the Upper Paleolithic period—and was perhaps increased during the conquest of northern Italy by the Germanic Lombards in the sixth through eighth centuries. Today, the northern European component predominates in northern European populations, while the Mediterranean component is more common in southern Europe.
TUSCAN (ITALY)
% Italy & Southern Europe 67%
Eastern Europe 15%
Northwestern Europe 9%
West Mediterranean 9%
YOU %
Italy & Southern Europe 71%
West Mediterranean 14%
Asia Minor 8%
Northwestern Europe 7%
Your Second Reference Population: Greek
This reference population is based on native populations from Greece. The large Southern European and Asia Minor components reflect the strong influence of agriculturalists from the Fertile Crescent in the Middle East, who arrived here more than 10,000 years ago. The smaller Eastern European component likely comes from the pre-agricultural population of Europe. Today, this component predominates in northern European populations, while the Mediterranean component is more common in southern Europe.
GREEK
%
Italy & Southern Europe 44%
Eastern Europe 32%
Asia Minor 19%
Jewish Diaspora 5%
YOU
%
Italy & Southern Europe 71%
West Mediterranean 14%
Asia Minor 8%
Northwestern Europe 7%