Which country has the most post-capitalist culture (green vMeme of Spiral Dynamics)?

Maciamo

Veteran member
Admin
Messages
9,951
Reaction score
3,232
Points
113
Location
Lothier
Ethnic group
Italo-celto-germanic
I have mentioned and summarised the concept of Spiral Dynamics in this thread. I find the concept fascinating and extremely useful to study the evolution of societies in history, but also to understand the current socio-political situation in modern countries and forecast how societies are going to evolve.

Here is a chart giving a quick overview of the evolution of vMemes.

vMEMEsSocietyGPT1.jpg


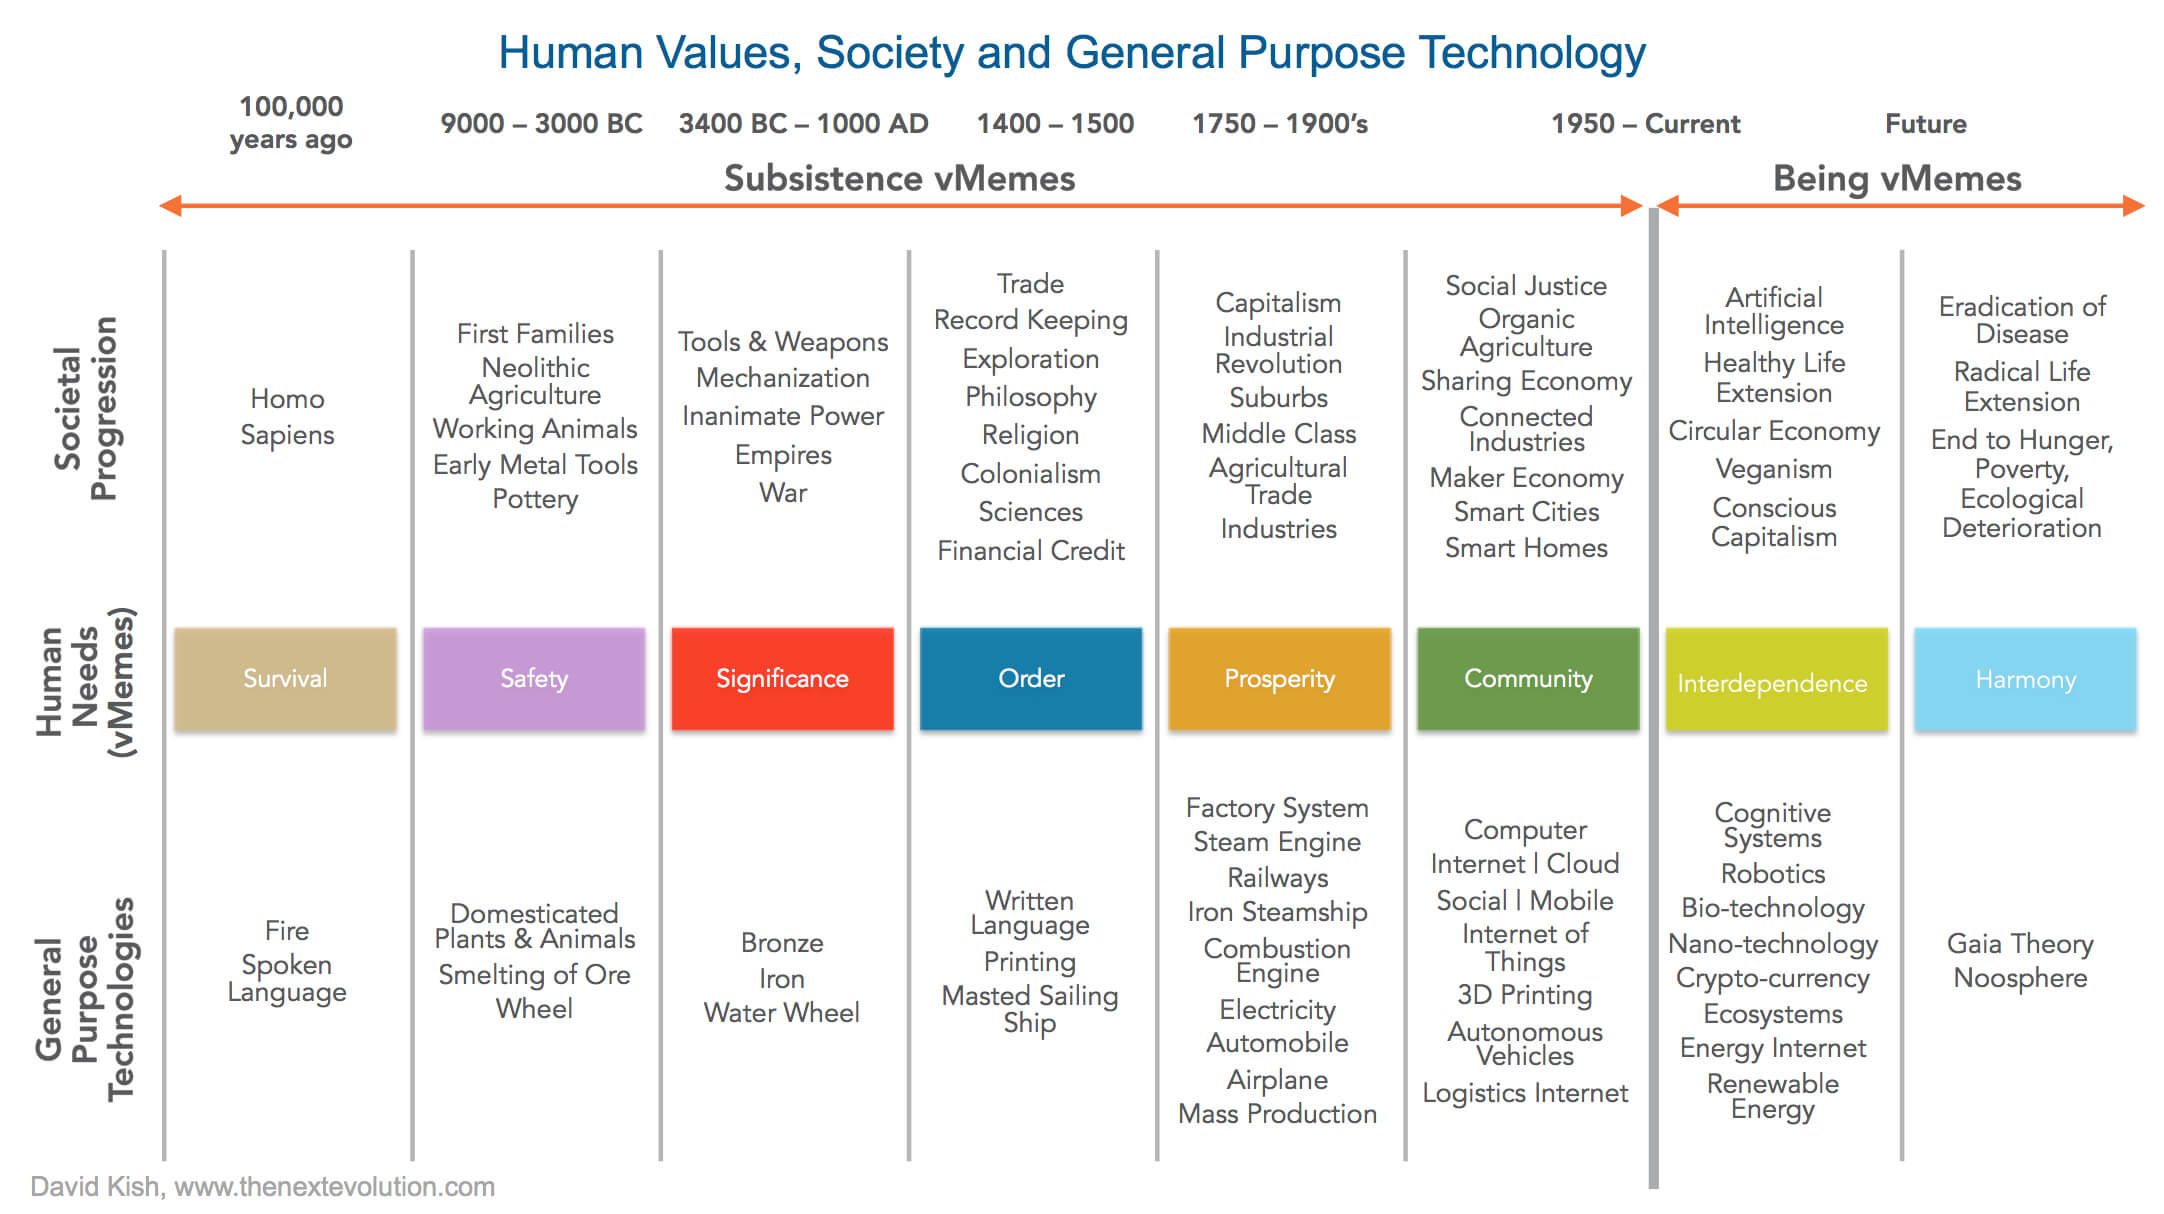
The chart is an oversimplification as people within a same country move up the colour spiral at their own pace and settle at one level based on their specific needs. Not everyone in an orange dominated society will reach the orange vMeme. In fact, in most developed countries today a good part of the population (around 30-50%) is still in the blue (Order). That includes a majority of people who work at lower levels of the administration/bureaucracy, in the police and army, for religious organisations, but also lots of school teachers, hospital staff, clerks, secretaries, and anyone working in a very structured and hierarchical environment following rules from above (a boss, the state, one's religion).

People in the orange vMeme (Prosperity) are more self-driven, independent, competitive and ambitious. They include entrepreneurs, investors, bankers, stock brokers/traders, managers, directors, lawyers, realtors, accountants, consultants, advisers, marketers, sales people, programmers, software developers, etc. They make up 20-35% of the working population in developed countries.

What interests me here is to determine the percentage of people who have reached the green vMeme (Community) in various countries. The green includes the post-modern philosophy (relativism, subjectivism, pluralism), post-capitalist economy (sharing economy, participatory economics, commons-based peer production, open-source development), responsible and sustainable capitalism, ethical consumerism, concern for ecology and social fairness, egalitarianism, multiculturalism...

To assess how much a society has adopted the values of the green vMeme, I am going to give scores relating to ecology, fair trade, and collaborative/peer production.


1. Consumption of Fairtrade products by country


CountryFairtrade retail (in €/capita - 2015)GDP per capita 2017BalancedFairtrade score
United Kingdom33.939,7588.52658584485.27
Ireland54.269,6047.78690879877.87
Switzerland57.780,1017.203405772.03
Finland31.745,6706.9410991969.41
Sweden36.154,0436.67986603366.80
Austria21.647,7184.52659373845.27
Denmark18.157,5333.14602054531.46
New Zealand13.7742,936
3.207098938
32.07
Netherlands13.248,7542.70747015627.07
Germany1244,9762.66808964826.68
Belgium10.243,2892.35625678623.56
Norway15.675,2952.0718507220.72
Luxembourg19.2106,8061.79765181717.98
France6.738,4151.74411037417.44
Canada7.644,9741.68986525516.90
Australia9.657,6131.66629059416.66
Portugal2.718,8821.4299332714.30
Estonia2.519,7931.26307280412.63
Italy1.632,7470.48859437514.89
United States2.960,0550.48289068354.83
Czechia0.820,3260.39358457153.94
Latvia0.415,6250.2562.56
Spain0.628,3540.21161035482.12
Lithuania0.316,4500.18237082071.82
Japan0.638,2200.15698587131.57
Slovakia0.217,5520.11394712851.14
Hong Kong0.461,0000.065573770490.66
South Korea0.130,0250.033305578680.33

The 'balanced score' column is the € spent on Fairtrade products per $10,000 of GDP.

Source of Fairtrade retail data (for 2015). Source for New Zealand. Countries that aren't listed above have consumption of Fairtrade products under 0.1€ per person.

The GDP per capita (nominal) figures are from the United Nations for 2017.

When it comes to ethical consumption, the UK, Ireland top the list, followed by Germanic countries.
 
Last edited:
2. Peer Production : Wikipedia users & articles per 1000 speakers

LanguageWikipedia usersNo of SpeakersUsers per 1000 speakersArticles/1000 speakersAverage users+articles/1000Wikipedia score
Basque113,632750,000151.5093333482316.754666731.68
Swedish735,7859,197,09080.00193539405.6242.800967724.28
Icelandic74,322330,000225.2181818151.8188.509090918.85
Norwegian604,8194,453,000135.8228161215.5175.66140817.57
Estonian141,8591,105,400128.3327302190.2159.266365115.93
Welsh61,943965,00064.18963731135.799.944818659.99
Hebrew658,1705,302,770124.118149650.887.459074798.75
Finnish454,9775,392,18084.3771906790.487.388595348.74
Slovenian192,0502,085,16092.1032438880.986.501621948.65
Dutch1,082,96521,944,69049.3497515892.170.724875797.07
Catalan361,0227,200,00050.1419444490.470.270972227.03
Macedonian89,3031,407,81063.4339861275.669.516993066.95
Latvian92,2671,552,26059.4404287965.962.67021446.27
Danish384,0445,522,49069.54181947.158.32090955.83
Galician109,0482,355,00046.304883237058.152441615.82
Lithuanian144,7473,001,86048.2191041666.757.459552085.75
Serbian268,3478,957,90629.956442957150.478221475.05
English39,433,068505,000,00078.0852831712.145.092641584.51
Scots72,9831,500,00048.6553333338.3543.502666674.35
Spanish5,894,75474,980,46078.61720243.441.00860124.10
Slovak190,8845,187,74036.7952133345.140.947606664.09
French3,837,87674,980,46051.185015429.840.49250774.05
Croatian240,7095,752,09041.8472242338.139.973612114.00
German3,503,08378,245,28044.770534431.338.03526723.80
Hungarian450,67112,606,13035.7501469537.536.625073483.66
Czech503,41613,373,48037.6428573634.235.921428683.59
Bulgarian273,7518,157,77033.5570872932.432.978543653.30
Polish1,044,63838,663,78027.0185170736.731.859258543.19
Italian2,001,89063,655,04731.4490381325.428.424519062.84
Irish43,8141,930,00022.701554427.425.05077722.51
Romanian527,00823,782,99022.1590304717.219.679515231.97
Malay258,19215,848,50016.2912578521.618.945628921.89
Greek307,63413,432,94022.9014646113.418.15073231.82
Russian2,793,088167,332,23016.691871029.813.245935511.32
Japanese1,660,074125,000,00013.2805929.711.4902961.15
Turkish1,200,10770,805,93016.94924422510.974622111.10
Portuguese2,432,890220,000,00011.058590914.77.8792954550.79
Korean634,11877,166,2308.217558386.57.358779190.74
Arabic1,893,097315,421,3006.0018045713.34.6509022850.47
Cantonese203,60962,221,5603.2723223271.42.3361611630.23
Chinese2,967,5831,197,294,0602.4785748960.91.6892874480.17

The main problem with these statistics is that they are by language and not by country. It is fine for most countries, but not for languages spoken in many countries like English, Spanish and Portuguese. That's why I added regional languages like Basque, Catalan, Galician, Welsh, Irish and Scots to get a better idea of the local European production in these countries.
 
Last edited:
3. Ecology score

CountryRecycling rate (2018)CO2 emissions per capita (2018)Ecology score (Recycling - CO2)
Germany67.39.158.2
Slovenia58.97.551.4
Austria57.78.249.5
Switzerland52.54.847.7
Lithuania52.5547.5
Netherlands55.99.546.4
Belgium54.69.245.4
South Korea5913.645.4
Denmark49.95.844.1
Italy49.85.844
Sweden45.84.541.3
Australia5816.841.2
France44539
United Kingdom44.15.638.5
Finland42.38.833.5
Luxembourg50.116.933.2
Ireland40.47.732.7
Hungary37.45.432
Norway40.79.431.3
Spain36630
Slovakia36.3729.3
Poland34.38.825.5
Bulgaria31.56.325.2
Czechia34.510.424.1
Portugal28.95.123.8
Latvia25.24.121.1
Croatia25.34.720.6
United States35.216.119.1
Estonia281414
Iceland25.812.113.7
Greece18.96.512.4
Japan219.411.6
Israel197.911.1
Cyprus16.16.39.8
Peru111.89.2
Costa Rica101.88.2
Canada2416.17.9
Turkey11.54.47.1
Romania11.14.17
Argentina114.76.3
Uruguay82.85.2
Malta6.53.53
Mexico53.81.2
Montenegro5.56.3-0.8
Brazil12.4-1.4
Chile14.6-3.6
North Macedonia03.9-3.9
Russia712.1-5.1
Serbia0.36.3-6
Bosnia & Herzegovina07.8-7.8
China307.222.8
Taiwan5510.344.7
Singapore594.354.7
Qatar144-43
Kuwait1123.9-12.9
Saudi Arabia118.6-17.6
New Zealand587.150.9
Hong Kong305.724.3
Malaysia21813

It was not easy to choose data that would reflect the environmental awareness, concern and action of individual citizens, as opposed to governments and companies.

I wanted to include solar panels penetration by country, but that would have given an unfair advantage to sunnier countries where PV panels are more useful and profitable. What's more, I could not find data on the percentage of residential homes equipped with PV, as opposed to companies and industries.

Likewise the total renewable energy produced in a country per capita is not a good indicator as it depends on government policies (just a few people) and the natural resources and opportunities available in each country, rather than actual desire to switch to renewable energy.

I wish I could have added the percentage of people donating to environmental charities (as opposed to all charities, which may be motivated by religion or other concerns in the blue vMeme), but I could not find such data.

That's why I had to settle for municipal waste recycling rates and CO2 emissions per capita. Nevertheless combining the two gives a surprising realistic score of environmental concern by country.
 
Last edited:
4. Social Progress & Gender Equality

CountrySocial ProgressGender InequalitySocial score
Norway90.950.04486.55
Switzerland89.890.03786.19
Denmark90.090.0486.09
Sweden89.450.0485.45
Finland89.560.0584.56
Netherlands88.310.04184.21
Iceland89.290.05783.59
France87.790.05182.69
Belgium86.770.04582.27
Canada88.810.08380.51
Germany88.840.08480.44
Spain87.470.07480.07
Luxembourg87.660.07879.86
South Korea85.610.05879.81
Austria86.40.07379.1
Portugal87.120.08179.02
Slovenia85.80.06978.9
Italy85.690.06978.79
Ireland87.970.09378.67
Japan88.340.09978.44
Australia88.020.10377.72
Singapore83.230.06576.73
United Kingdom87.980.11976.08
New Zealand88.930.13375.63
Estonia83.980.09174.88
Cyprus83.140.08674.54
Israel81.440.171.44
Czech Republic84.360.13770.66
Greece82.480.12270.28
Poland81.250.1269.25
Lithuania81.30.12468.9
Croatia79.210.12267.01
United States83.620.18265.42
Latvia80.420.16963.52
Malta82.630.19563.13
Slovakia80.430.1961.43
Serbia71.590.16155.49
North Macedonia68.920.14554.42
Bulgaria76.170.21854.37
Hungary78.770.25852.97
Costa Rica80.650.28552.15
Chile80.020.28851.22
Uruguay77.770.27550.27
Qatar69.370.20249.17
China64.540.16348.24
Malaysia74.170.27446.77
Russia69.710.25544.21
Romania74.810.31643.21
Saudi Arabia63.950.22441.55
Argentina76.860.35441.46
Mexico71.510.33438.11
Turkey67.490.30536.99
Brazil72.870.38634.27
Peru71.310.38133.21

The reflection of egalitarian, fairness and equal opportunities can be encapsulated in a combination of two indices. The first is the Social Progress Index, a complex index that takes into account basic human needs, health, environment, education, access to information, personal rights, personal freedoms and choices, social inclusiveness of LGBT and ethnic minorities, equal opportunities by gender and socioeconomic status, etc. The second is the United Nations' Gender Inequality Index, a negative score which I deducted (after multiplying by 100 as it is was rated on 1 and not 100) to obtain an overall social score. I know that gender equality was already included in the social progress index, but I felt it was important to give it more weight as gender equality is a very important value of the green vMeme.
 
Last edited:
Overall score

I gave a score on 100 for the first 3 categories, made an average in % then added a custom Wikipedia score to the total as a bonus. In other words: (ecology + social + fairtrade)/3 + Wikipedia.

Unsurprisingly Sweden tops the ranking for all values associated with the green vMeme. Note that I don't have Fairtrade data for Iceland and Israel, so their overall score is a bit different than what it should be.

The levels of the spiral are about values and mindset. Even though the 6th level, or green vMeme, corresponds to a postmodern society, the four factors taken into account in my assessment are purely about values and not wealth or GDP per capita. That's why countries like Slovenia, Estonia and Lithuania can outperform economic powerhouses like the United States or Australia. In fact Luxembourg, which has the highest GDP per capita in the Western world, only gets an average score here. Countries obsessed with making money are often dominated by the orange vMeme (5th level). With too many people stuck in the orange mindset, it's only logical that fewer move on the to green level of consciousness, which is about quality of life rather than getting rich at all costs.

CountryEcology scoreSocial scoreFairtrade scoreWikipedia scoreOverall score
Sweden41.385.4566.824.2888.80
Switzerland47.786.1972.033.972.54
Finland33.584.5669.418.7471.23
United Kingdom38.576.0885.274.471.02
Iceland13.783.5918.8567.50
Ireland32.778.6777.873.5166.59
Norway31.386.5520.7217.5763.76
Austria49.579.145.273.861.76
Denmark44.186.0931.465.8359.71
Netherlands46.484.2127.077.0759.63
Germany58.280.4426.683.858.91
Belgium45.482.2723.56656.41
Slovenia51.478.908.6552.08
France3982.6917.444.0550.43
Israel11.171.448.7550.02
Estonia1474.8812.6315.9349.77
Australia41.277.7216.664.549.69
Luxembourg33.279.8617.983.947.58
Italy4478.794.892.8445.40
Lithuania47.568.91.825.7545.16
Portugal23.879.0214.35.744.74
South Korea45.479.810.330.7442.59
Spain3080.072.123.841.20
Canada7.980.5116.94.539.60
Czechia24.170.663.943.5936.49
Latvia21.163.522.566.2735.33
Poland25.569.2503.1934.77
Slovakia29.361.431.144.0934.71
United States19.165.424.834.534.28
Croatia20.667.010433.20
Hungary3252.9703.6631.98
Japan11.678.441.571.1531.69
Cyprus9.874.5401.8229.93
Bulgaria25.254.3703.329.82
Greece12.470.2801.8229.38
North Macedonia-3.954.4206.9523.79
Serbia-655.4905.0521.55
Romania743.2101.9718.71
Turkey7.136.9901.115.80
Russia-5.144.2101.3214.36
 
Last edited:
5. LGBT Acceptance

I am going to add a 5th dimension: social acceptance of LGBT people based on a 2019 global report of the same name by the Williams Institute at UCLA. The data is for the period 2014-2017.

CountryUCLA 2017 Score in percent
Iceland8.989
Netherlands8.686
Canada8.282
Norway8.282
Spain8.181
Belgium7.979
Denmark7.979
Ireland7.979
Sweden7.979
Luxembourg7.777
United Kingdom7.777
Malta7.676
Uruguay7.676
New Zealand7.575
Finland7.474
Germany7.474
Switzerland7.474
Australia7.373
United States7.272
France7.171
Argentina6.969
Austria6.868
Brazil6.868
Chile6.767
Hong Kong6.565
Italy6.464
Portugal6.464
Mexico6.363
Costa Rica6.161
Czechia660
Slovenia5.959
Taiwan5.757
Israel5.454
Peru5.353
Croatia5.252
Cyprus5.151
Greece550
Slovakia550
Estonia4.949
Hungary4.949
Japan4.949
South Korea4.949
Poland4.848
Singapore4.848
Bulgaria4.646
Latvia4.444
Turkey4.444
Serbia4.242
Malaysia4.242
Lithuania4.141
Romania4.141
China3.939
Kuwait3.535
Russia3.434
Qatar3.232
North Macedonia330
Saudi Arabia330

Here is the new overall score with all 5 dimensions.

UPDATE

I have added 7 Latin American countries + China, Hong Kong, Taiwan, Singapore, Malaysia, Saudi Arabia, Qatar and Kuwait.

CountryEcology scoreSocial scoreFairtrade scoreLGBT scoreTOTALWikipedia scoreOverall score
Sweden41.385.4566.87968.1424.2892.42
Iceland13.783.598962.1018.8580.95
Finland33.584.5669.417465.378.7474.11
Switzerland47.786.1972.037469.983.973.88
United Kingdom38.576.0885.277769.214.473.61
Norway31.386.5520.728255.1417.5772.71
Ireland32.778.6777.877967.063.5170.57
Netherlands46.484.2127.078660.927.0767.99
Denmark44.186.0931.467960.165.8365.99
Austria49.579.145.276860.473.864.27
Germany58.280.4426.687459.833.863.63
Belgium45.482.2723.567957.56663.56
New Zealand50.975.6332.077558.404.562.90
Singapore54.776.734859.810.1759.98
Australia41.277.7216.667352.154.556.65
France3982.6917.447152.534.0556.58
Slovenia51.478.905947.338.6555.98
Luxembourg33.279.8617.987752.013.955.91
Israel11.171.445445.518.7554.26
Estonia1474.8812.634937.6315.9353.56
Spain3080.072.128148.303.852.10
Canada7.980.5116.98246.834.551.33
Taiwan44.75750.850.1751.02
Portugal23.879.0214.36445.285.750.98
Italy4478.794.896447.922.8450.76
Malta363.137647.3847.38
Lithuania47.568.91.824139.815.7545.56
United States19.165.424.837240.344.544.84
South Korea45.479.810.334943.640.7444.38
Czechia24.170.663.946039.683.5943.27
Slovakia29.361.431.145035.474.0939.56
Latvia21.163.522.564432.806.2739.07
Croatia20.667.0105234.90438.90
Poland25.569.2504835.693.1938.88
Hungary3252.9704933.493.6637.15
Uruguay5.250.2707632.874.1036.97
Japan11.678.441.574935.151.1536.30
Cyprus9.874.5405133.841.8235.66
Greece12.470.2805033.171.8234.99
Bulgaria25.254.3704631.393.334.69
Costa Rica8.252.1506130.344.1034.44
Argentina6.341.4606929.194.1033.29
Chile-3.651.2206728.664.1032.76
Hong Kong24.30.666529.990.2330.22
Mexico1.238.1106325.584.1029.68
Peru9.233.2105323.854.1027.95
Serbia-655.4904222.875.0527.92
China22.848.2403927.510.1727.68
Malaysia1346.7704225.441.8927.33
North Macedonia-3.954.4203020.136.9527.08
Brazil-1.434.2706825.220.7926.01
Romania743.2104122.801.9724.77
Turkey7.136.9904422.021.123.12
Russia-5.144.2103418.281.3219.60
Saudi Arabia-17.641.5503013.490.4713.96
Qatar-4349.170329.540.4710.01
Kuwait-12.90357.370.477.84
 
Last edited:
I find it pretty impressive that, if LGBT acceptance is a good indication of other "cultural war" controversial topics in the modern era, opposing conservatives vs. progressives, Eastern Europe, right beside Western and Central European countries, is further from the average tolerance of societal outgroups (LGBTs and, I think very probably, different races, immigrants and ethnic minorities) in Western/Central Europeans than Latin America. If you list only the 40 countries with highest levels of acceptance of LGBTs and homosexuality, it's striking that only 2 countries could perhaps be described as Eastern European, but I personally think are culturally and geographically much more Central European than anything else (Slavic language notwithstanding): Czech Republic and Slovenia. On the other hand, there are several Latin American countries among the top 40, and even some African and Asian nations. But no Eastern European country. It's a striking contrast.

By the way, it really surprises me that Brazil scores better than Italy and Portugal, because I think that even though Brazil has increased LGBT acceptance dramatically since especially the mid-late 1990s there is still a very large minority of relentlessly unaccepting people. :-o

40 top countries in LGBT acceptance

WESTERN/CENTRAL EUROPE

Iceland
Netherlands
Norway
Spain
Belgium
Ireland
Sweden
Denmark
Great Britain
Luxembourg
Malta
Germany
Finland
Switzerland
France
Austria
Italia
Portugal
Czech Republic
Slovenia

NORTH AMERICA & ANGLO-SAXON OCEANIA (ANGLOSPHERE)
Canada
New Zealand
Australia
United States

LATIN AMERICA

Uruguay
Puerto Rico
Argentina
Brazil
Chile
Mexico
Costa Rica
Cuba
Colombia
Venezuela

ASIA
Nepal
Philippines
Hong Kong

AFRICA

Cape Verde
South Africa
 
Ygorcs, personally I am not surprised. Latin America is culturally close to Spain and Portugal and societal trends tend to spread around countries sharing a same language and close cultural affinities.

There is also a moderate correlation with GDP per capita, so that wealthier countries in Latin America are generally the most progressive. That correlation tend to collapse in countries with very strong disparities between rich and poor like the USA and oil-rich Arab countries.

Another factor in play in ethnic diversity in a society. Latin American countries are a melting pot of Europeans, Africans and Native Americans and someone growing up in such an environment would normally be more tolerant toward different-looking people (unless there is racial segregation like in the USA and South Africa until recently). A higher racial tolerance makes it easier to be more accepting of LGBT too. Countries like Russia, Poland, Hungary or Serbia are neither accepting towards other races nor towards LGBT. As you mentioned, Slovenia and Czechia are much closer to Central Europe culturally.

On a side note, I have always been amazed at how socially advanced Costa Rica is compared relative to its GDP per capita. It's no wonder that it scores amongst the happiest countries in the world alongside Nordic countries.
 
I have just added seven Latin American countries to the overall score table above for the sake of comparison. Uruguay ranks first among them, between Hungary and Japan.
 
I wish I could have included data about the donations to environmental charities pe capita by country, but I could not find the data. The best I could find is the Greenpeace revenues by country (or group of countries) for years 2014 and 2015, but it's not possible to determine the exact numbers on the graph. Nevertheless we see that German members contribute far more than anybody else - almost twice more than the US members despite having a fourth of the population! Per capita, the Swiss, Dutch and Nordic do very well too, which is perfectly in line with the ecological and overall rankings above.

attachment.php


UPDATE

I zoomed on the chart and measured carefully with a ruler the height of each bar to determine the amount of donations by country for year 2015. I then divided by the population for each country and multiplied by 100, then divided that number by the GDP per capita and multiplied it by 20,000 to get a "Greenpeace score per capita adjusted for GDP per capita".

CountryGreenpeace DonationsPopulationGDP per capita 2017Score
Switzerland21,000,000850000080,10161.69
New Zealand6,000,000470000042,93659.47
Netherlands21,000,0001700000048,75450.67
Belgium7,250,0001100000043,28930.45
Germany56,000,00082,000,00044,97630.37
United Kingdom33,500,00066,000,00039,75825.53
Nordic countries21,000,0002700000061,12025.45
Australia130000002500000057,61318.05
France19,000,00066,000,00038,41514.99
Greece12500001050000018,19813.08
Spain8,500,0004600000028,35413.03
Canada7,250,0003700000044,9748.71
Italy7,250,0006000000032,7477.38
Mexico35000001260000008,9676.20
Brazil4,000,0002060000009,8213.95
United States32,000,00032700000060,0553.26
Czechia2500001050000020,3262.34
Japan125000012600000038,2200.52
Russia25000014400000010,9560.32
 
Last edited:
I have just added China, Hong Kong, Taiwan, Singapore, Malaysia, Saudi Arabia, Qatar and Kuwait to the overall score table.
 
I have organised all the above posts into an article with sortable tables.


This thread has been viewed 8631 times.

Back
Top