Install the app
How to install the app on iOS
Follow along with the video below to see how to install our site as a web app on your home screen.

Note: This feature currently requires accessing the site using the built-in Safari browser.
You are using an out of date browser. It may not display this or other websites correctly.
You should upgrade or use an alternative browser.
You should upgrade or use an alternative browser.
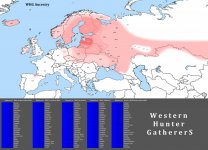
WHG Ancestry map
- Thread starter Alpakut
- Start date
View attachment 13316
calculated with G25
Strange map. Do model this with EEF? EEF probably eat up some of the affinities of WHG in Western Europeans. Brits usually have 14-16% WHG ancestry
Alpakut
Regular Member
- Messages
- 106
- Reaction score
- 18
- Points
- 0
- Location
- Saray
- Ethnic group
- Turkic/Iranian
- Y-DNA haplogroup
- L1b Elite Hun
The results are "strange" because I used the distance model, not the ultimate component (multi) model. And yes you are right, it is strange because in the multi model English reach 15.4% WHG, but Finns only 10.6%. However in the distance model Finns reach 42.9% WHG and English only 2.0%. So you can consider this map rather a genetic concentration map based on common shared alleles within a gene pool. Finns turn out stronger in this matter, which makes it more plausible since strengthness of common shared alleles tell us more about true ancestry (primary priority) then admixed ancestry like in England (secondary priority).Strange map. Do model this with EEF? EEF probably eat up some of the affinities of WHG in Western Europeans. Brits usually have 14-16% WHG ancestry
CORRECTION: Finnish WHG % mostly flipped to SHG (addiotional 29%). SHG = fresher WHG.
Last edited:
Pax Augusta
Elite member
Very innacurate.
Alpakut
Regular Member
- Messages
- 106
- Reaction score
- 18
- Points
- 0
- Location
- Saray
- Ethnic group
- Turkic/Iranian
- Y-DNA haplogroup
- L1b Elite Hun
I have to disappoint you, but this is the truth (as you can see in the blue G25 distance lists). G25 is the most accurate tool, and perhaps will always be.Very innacurate.
Alpakut
Regular Member
- Messages
- 106
- Reaction score
- 18
- Points
- 0
- Location
- Saray
- Ethnic group
- Turkic/Iranian
- Y-DNA haplogroup
- L1b Elite Hun
These maps were calculated with the same tool btw: 3 Bell Beaker ancestries (eupedia.com)Very innacurate.
So, logically, inaccurate can only be those who oppose this official WHG distance map.
Doggerland
Regular Member
- Messages
- 197
- Reaction score
- 78
- Points
- 0
- Ethnic group
- Germanic
- Y-DNA haplogroup
- I1a
- mtDNA haplogroup
- H5a1a
How does this exactly work???
What about the WHG ancestry in every European population???
Patterns of allele combinations for specific SNPs, mostly some hundred or thousands. The used SNPs where once selected by a program to search for differences in living ethnicities. This is one point where those admixtures are questionable. Another point is that some SNPs where not known or not sequenced as the program did the run to find the meaningful SNPs to define components some years ago.
Another problem is that many SNPs are used that may have ethnic differences in allele frequencies, but no direct influence on any human traits.
Many trait SNPs are not used by those calculators.
Converting SNPs/alleles to components is a dramatic complexity reduction and creates false relationships between populations that are heavily mixed.
All those maps are not based on WGS or high quality living population data, but often on HGDP which has very low quality data.
This creates problematic assumptions in my opinion and does not reflect reality.
The people who work with this tools often even did not accept their own results and tell things like: “Naah, isnt true, this component is falsely over-represented” if there is a sample that don’t match in the current theory.
And those people are often selective and do not include specific samples, because they are not ideologically interested in those populations, or even know that they existed.
The association of Mesolithic European Hunter Gatherers with Baltoslavic people can be replicated by multiple ways, so it is realistic. The percentages from those maps are not and vary strongly by the used method.
This thread has been viewed 3632 times.


