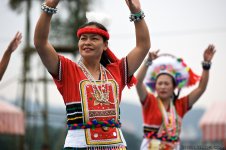
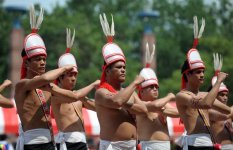
That might be true for the broad category southeast asian, but if you look at the more specific category of indigenous Taiwanese there is a notable resemblance to Polynesians. In a 2006 documentary called "Made in Taiwan" a well-known Maori and a well-known Samoan retraced their ancestors' migrations by travelling through tropical Polynesia and finally back to Taiwan. As they walked around the streets where a population of southern indigeneous Taiwanese lived they made remarks like "he could be my uncle". To them the resemblance was obvious.
DNA analysis shows that autosomally Polynesians who have only Polynesian ancestors are 75-80% of indigenous Taiwanese origin on average, with the other 20-25% being mainly Melanesian from the Bismark Archipelago. While individual variation means some will appear more Taiwanese than others, many Polynesians could pass for indigeneous Taiwanese.
Fijians generally identify as Melanesian rather than Polynesian. They have a larger proportion of Melanesian ancestry.
Samoan Gedmatch
Eurogenes K13:
Code:
Admix Results (sorted):
# Population Percent
1 East_Asian 69.11
2 Oceanian 22.98
3 South_Asian 3.99
4 Baltic 1.7
5 Amerindian 1.65
6 Sub-Saharan 0.58
Single Population Sharing:
# Population (source) Distance
1 Malay 25.77
2 Cambodian 28.19
3 Lahu 31.83
4 Vietnamese 33.58
5 Tibeto-Burman_Burmese 34.33
6 Miaozu 35
7 Dai 35.16
8 Tujia 35.94
9 She 36.47
10 Yizu 36.8
11 Naxi 38.46
12 Tu 42.12
13 Japanese 43.58
14 Xibo 51.86
15 Hezhen 53.28
16 Uygur 61.31
17 Hazara 65.94
18 Kirgiz 67.45
19 Aghan_Hazara 68.03
20 Kazakh 68.31
Mixed Mode Population Sharing:
# Primary Population (source) Secondary Population (source) Distance
1 76.5% Dai + 23.5% Papuan @ 2.28
2 68.3% Dai + 31.7% NAN_Melanesian @ 2.36
3 77.5% Vietnamese + 22.5% Papuan @ 5.12
4 69.4% Vietnamese + 30.6% NAN_Melanesian @ 5.38
5 71.1% Lahu + 28.9% NAN_Melanesian @ 9.33
6 79% Lahu + 21% Papuan @ 9.58
7 81.3% Cambodian + 18.7% Papuan @ 10.57
8 74.2% Cambodian + 25.8% NAN_Melanesian @ 10.83
9 68.3% She + 31.7% NAN_Melanesian @ 11.45
10 69.4% Miaozu + 30.6% NAN_Melanesian @ 12.23
11 83.4% Malay + 16.6% Papuan @ 12.45
12 76.8% She + 23.2% Papuan @ 12.47
13 76.8% Malay + 23.2% NAN_Melanesian @ 12.52
14 77.8% Miaozu + 22.2% Papuan @ 13.22
15 69.2% Tujia + 30.8% NAN_Melanesian @ 14.27
16 77.7% Tujia + 22.3% Papuan @ 15.49
17 71% Yizu + 29% NAN_Melanesian @ 22.03
18 70.2% Naxi + 29.8% NAN_Melanesian @ 23.46
19 79.9% Yizu + 20.1% Papuan @ 23.74
20 74.7% Tibeto-Burman_Burmese + 25.3% NAN_Melanesian
Harrapa World
-
Admix Results (sorted):
# Population Percent
1 SE-Asian 55.46
2 Papuan 23.71
3 NE-Asian 18.48
4 S-Indian 1.34
5 American 0.95
6 San 0.05
7 W-African 0.01
8 Pygmy 0.01
Single Population Sharing:
# Population (source) Distance
1 samoan (xing) 22.63
2 tongan (xing) 22.84
3 khmer-cambodian (xing) 29.25
4 thai (xing) 29.76
5 singapore-malay (sgvp) 31.69
6 kinh (1000genomes) 31.74
7 cambodian (hgdp) 32.18
8 dai-chinese (1000genomes) 32.24
9 lahu (hgdp) 32.34
10 dai (hgdp) 32.37
11 vietnamese (xing) 32.37
12 iban (xing) 43.15
13 khasi (chaubey) 45.3
14 burmanese (chaubey) 45.99
15 garo (chaubey) 48.93
16 miao (hgdp) 51.62
17 singapore-chinese (sgvp) 53.46
18 she (hgdp) 55.39
19 chinese (xing) 55.48
20 han-chinese-south (1000genomes) 56.48
Mixed Mode Population Sharing:
# Primary Population (source) Secondary Population (source) Distance
1 72.4% tongan (xing) + 27.6% chinese-american (hapmap) @ 1.85
2 72.4% tongan (xing) + 27.6% tujia (hgdp) @ 1.91
3 71.4% tongan (xing) + 28.6% han (hgdp) @ 1.97
4 70.9% tongan (xing) + 29.1% chinese (xing) @ 2.01
5 71.3% tongan (xing) + 28.7% han-chinese-south (1000genomes) @ 2.02
6 69.4% dai (hgdp) + 30.6% melanesian (hgdp) @ 2.07
7 70.9% tongan (xing) + 29.1% she (hgdp) @ 2.17
8 70.2% tongan (xing) + 29.8% singapore-chinese (sgvp) @ 2.33
9 69.4% tongan (xing) + 30.6% miao (hgdp) @ 2.48
10 81.1% samoan (xing) + 18.9% japanese (1000genomes) @ 2.78
11 75.6% tongan (xing) + 24.4% chinese-beijing (1000genomes) @ 2.81
12 69.5% dai-chinese (1000genomes) + 30.5% melanesian (hgdp) @ 3.32
13 75.3% tongan (xing) + 24.7% yi (hgdp) @ 3.33
14 79.1% samoan (xing) + 20.9% aonaga (reich) @ 3.35
15 78.8% samoan (xing) + 21.2% naga (metspalu) @ 3.51
16 76.5% dai (hgdp) + 23.5% papuan (hgdp) @ 3.6
17 75.5% tongan (xing) + 24.5% naxi (hgdp) @ 3.66
18 76.8% tongan (xing) + 23.2% han-nchina (hgdp) @ 3.67
19 79.1% samoan (xing) + 20.9% nysha (reich) @ 3.71
20 77% samoan (xing) + 23% han-nchina (hgdp) @ 4.14
 Reply With Quote