

A major new study published in Nature in May 2026 shows that the global obesity epidemic is not uniform: in many high‑income countries, the rise in obesity has slowed and plateaued (and in some cases may even slightly reverse), while in low‑ and middle‑income countries it continues to accelerate.
The work, by the NCD Risk Factor Collaboration (NCD‑RisC) and led by Bin Zhou and colleagues, is the most comprehensive quantitative map of obesity trends to date, covering 200 countries and territories from 1980 to 2024.
The researchers assembled:
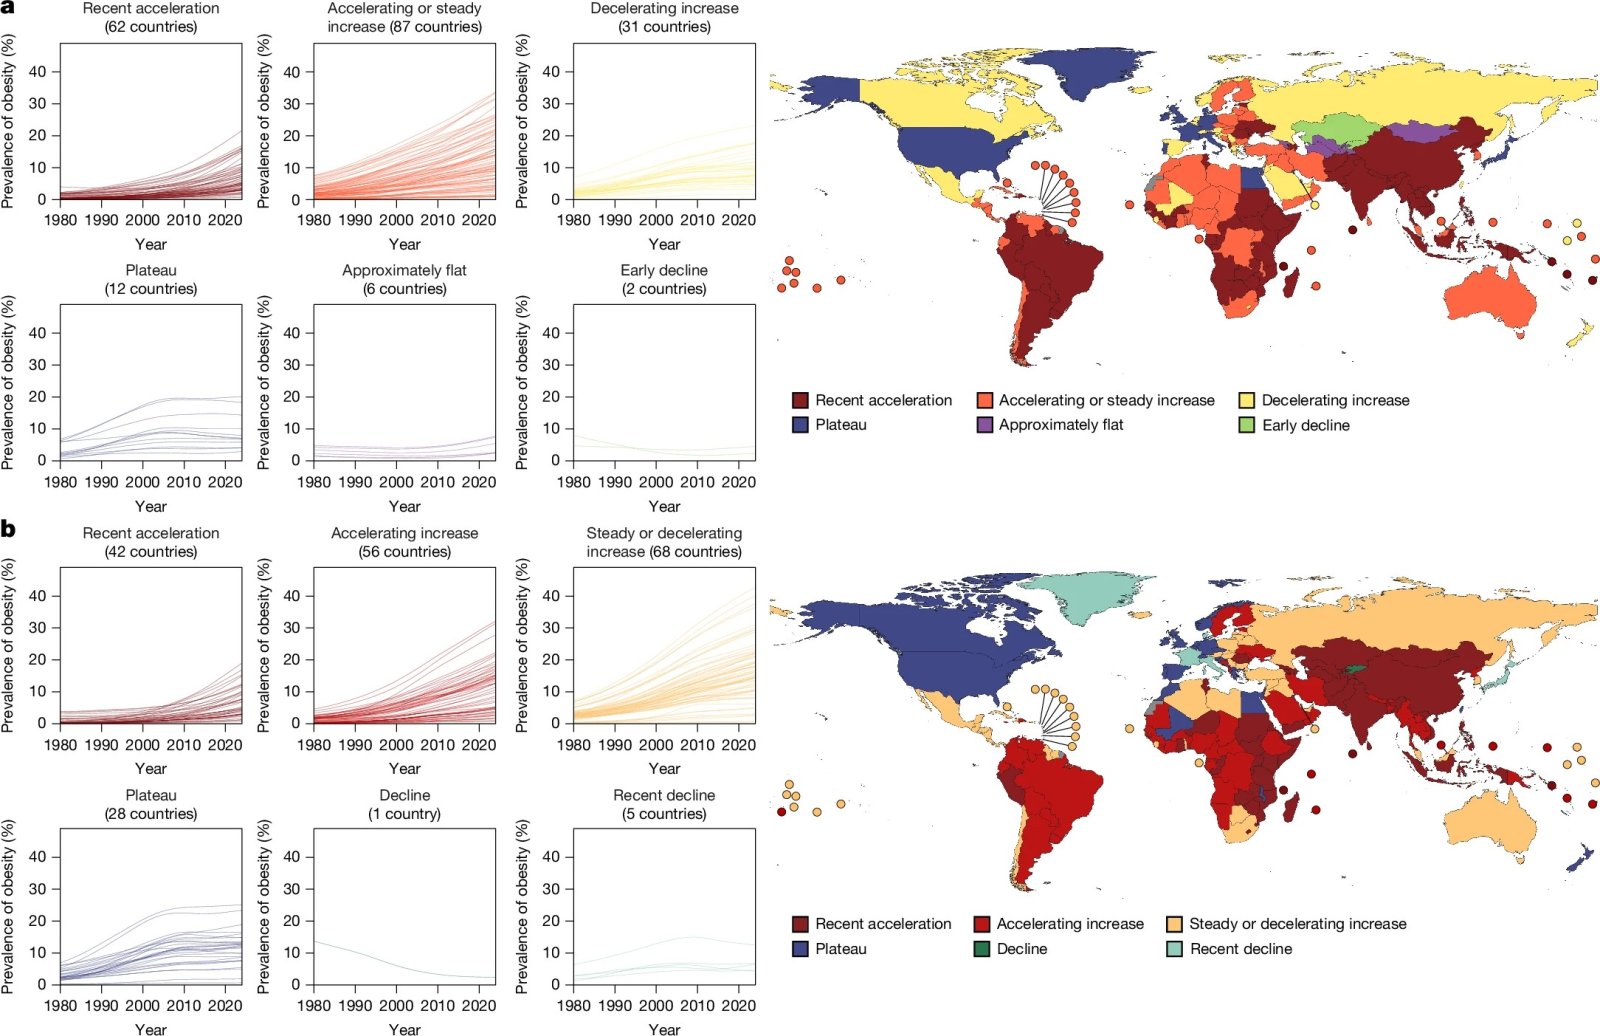
Phenotypes of national obesity trajectories in children and adolescents.
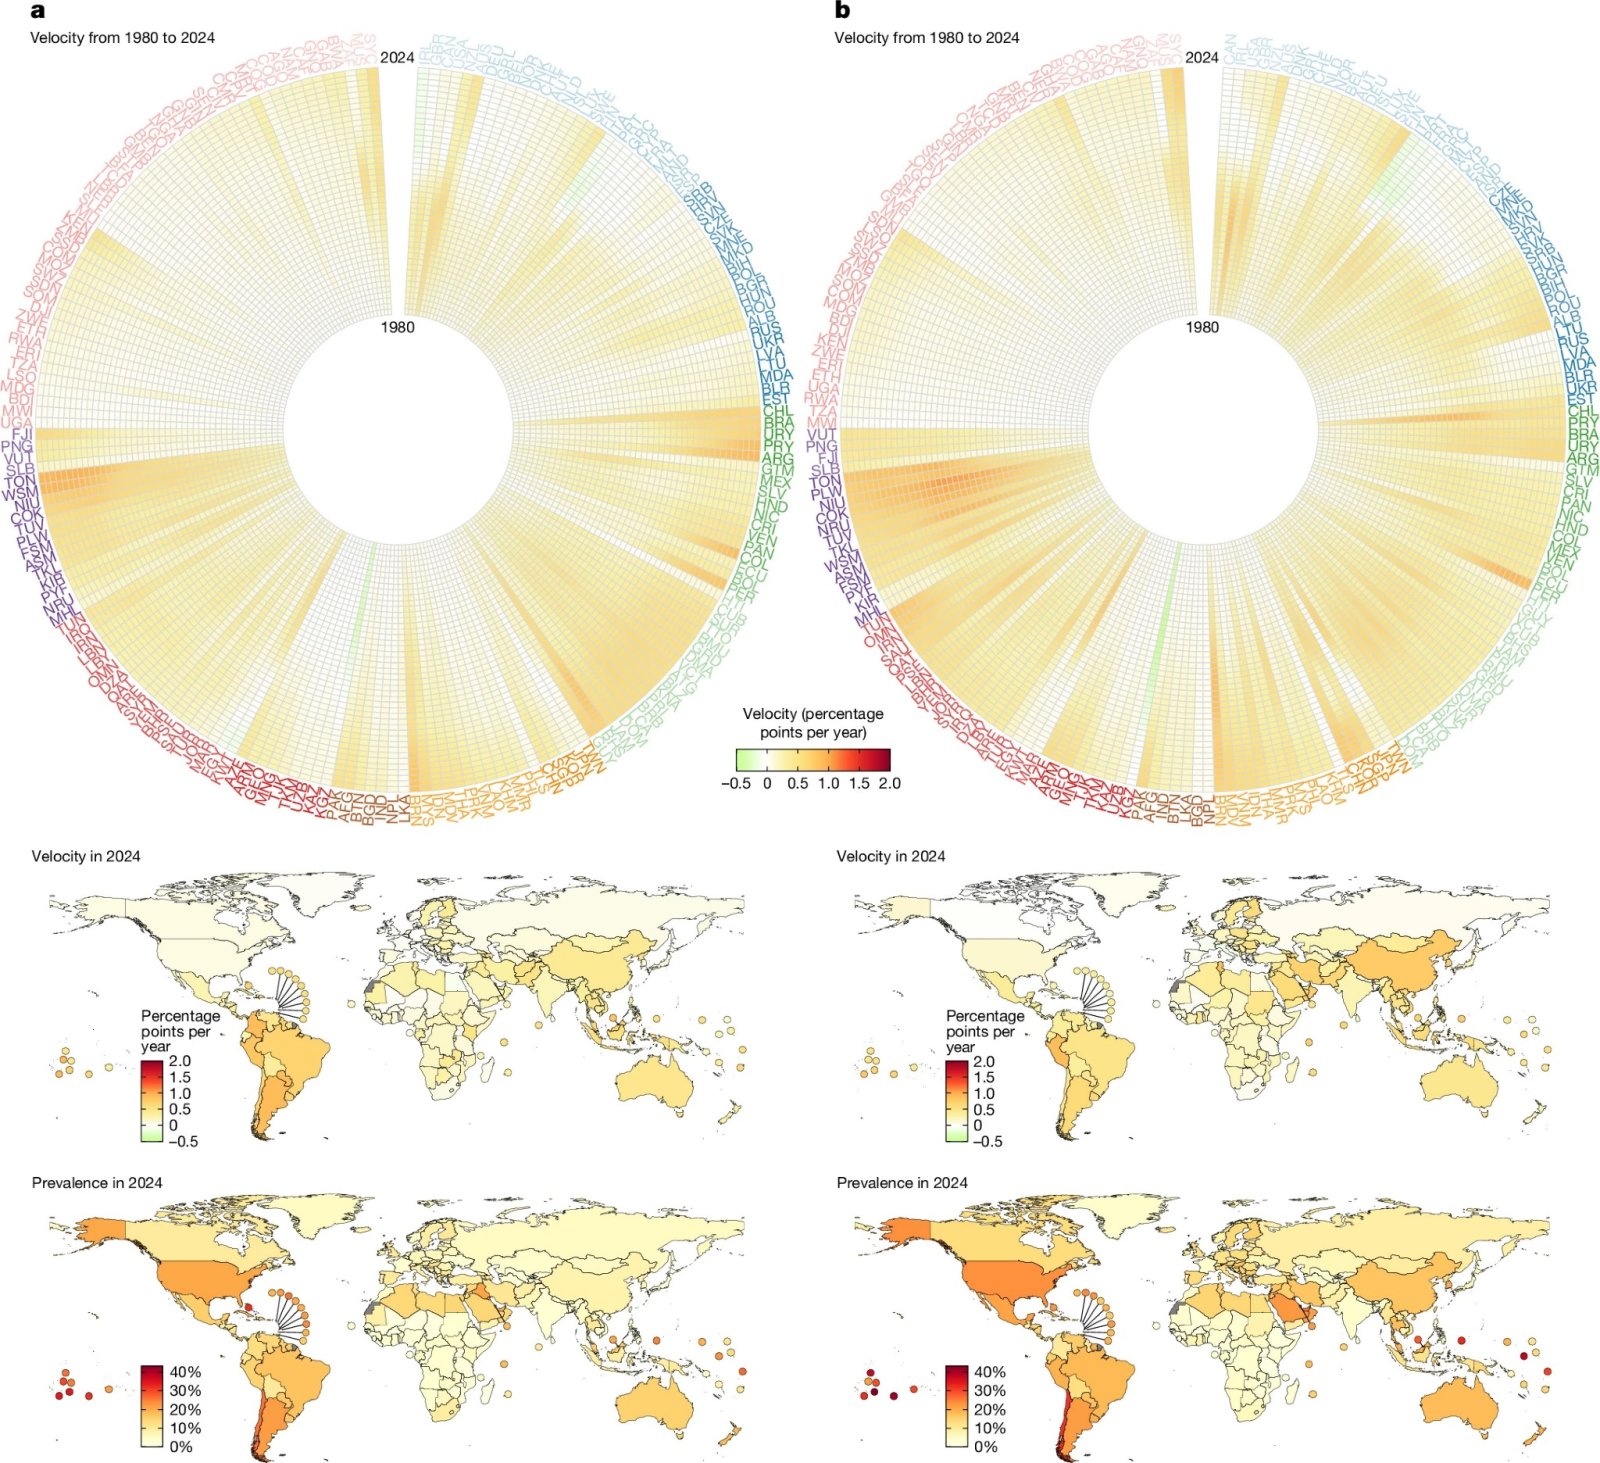
Velocity and prevalence of obesity in children and adolescents.
The work, by the NCD Risk Factor Collaboration (NCD‑RisC) and led by Bin Zhou and colleagues, is the most comprehensive quantitative map of obesity trends to date, covering 200 countries and territories from 1980 to 2024.
What the study did
Data and scopeThe researchers assembled:
- 4,050 population‑based studies
- With measured height and weight (not self‑reported)
- On 232 million participants aged 5 years and older
- Across about 200 countries and territories
- From 1980 to 2024
How obesity was defined
Obesity was defined using standard WHO cutoffs:- BMI ≥ 30 kg/m² for adults
- Age‑ and sex‑specific equivalent cutoffs for children and adolescents
Main findings
1. Obesity has risen in almost all countries, but trajectories differ drastically
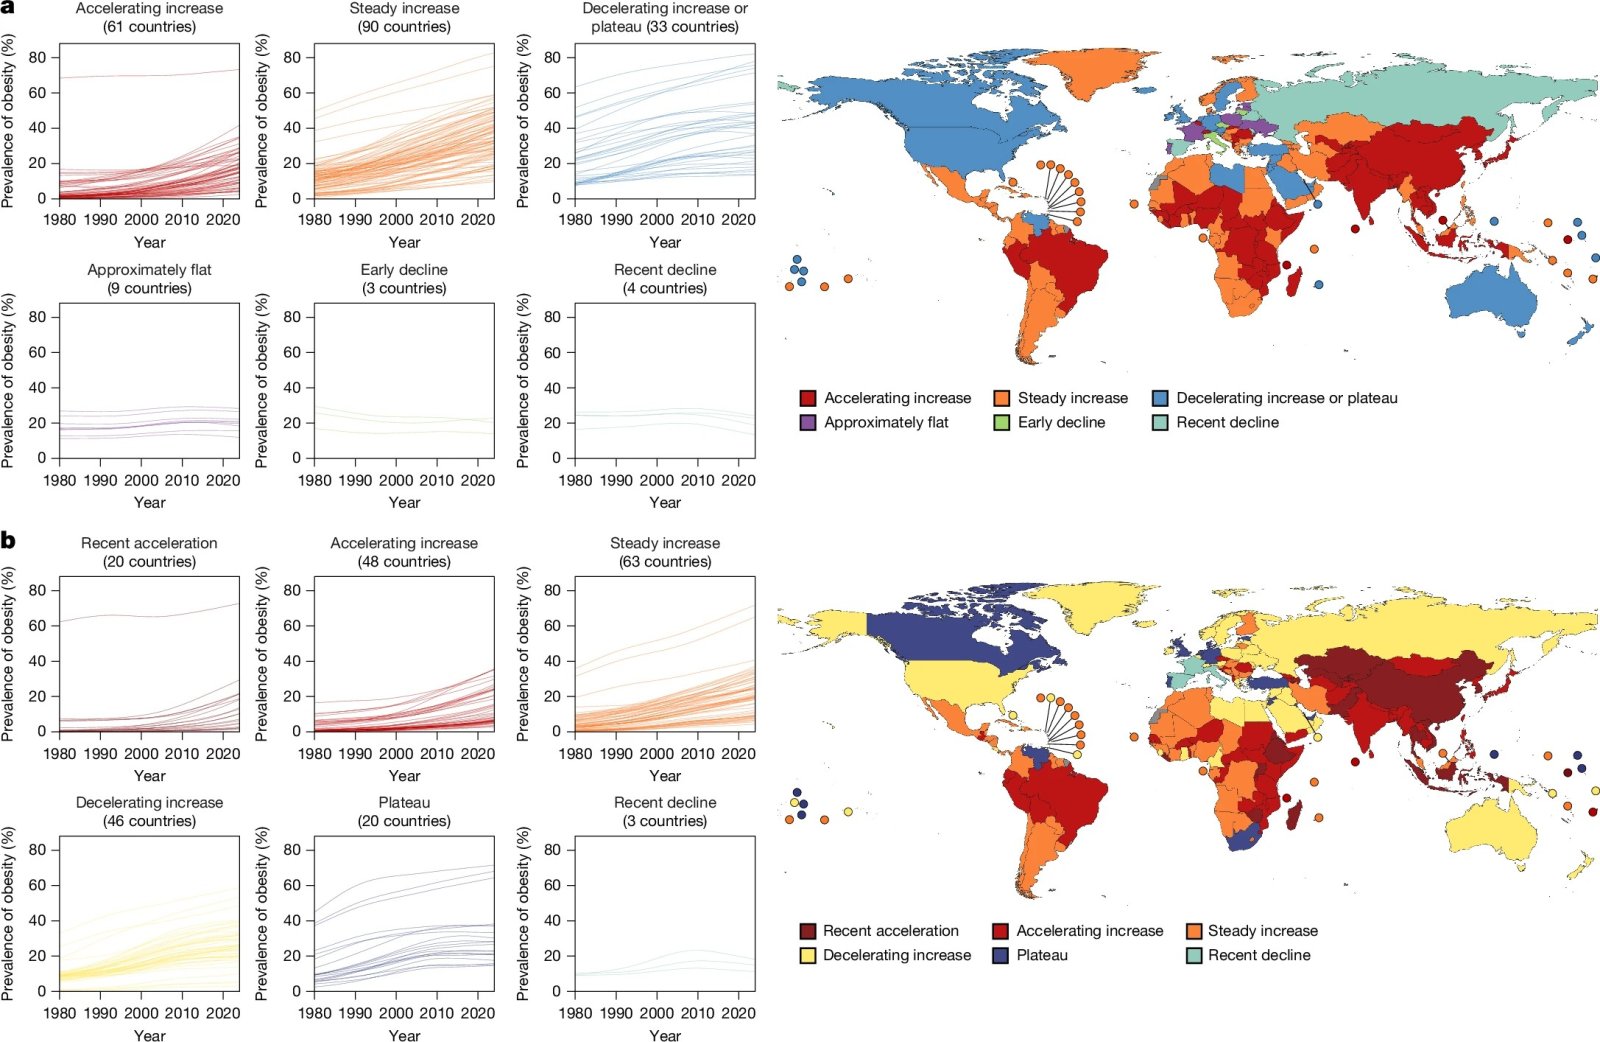
Across nearly every country, obesity prevalence increased over the 45‑year period, but the speed and pattern of that increase vary enormously.- In high‑income western countries (North America, Europe, Oceania), the rise in obesity was strong in the 1980s and 1990s, then decelerated and in many cases plateaued from the 2000s onward.
- In low‑ and middle‑income countries, especially in parts of Asia, Africa, and some regions of Latin America, the annual absolute change in prevalence has remained stable or increased, and in many countries the rate of increase is now accelerating.
2. Children and adolescents: plateau in many high‑income countries
In school‑aged children and adolescents:- The rise in obesity decelerated throughout the 1990s in many high‑income countries.
- From the 2000s, obesity prevalence plateaued in most of these countries at age‑standardized levels ranging from about 3–4% (e.g., girls in Japan, Denmark, France) to around 23% (boys in the USA).
- In some western European countries (e.g. Italy, Portugal, France) there are indications of a small decline in childhood and adolescent obesity since the 2000s.
- Similar patterns appear in some Central and Eastern European countries.
Phenotypes of national obesity trajectories in children and adolescents.
Velocity and prevalence of obesity in children and adolescents.
3. Adults: plateau followed, about a decade later
In adults:- High‑income western countries saw a slowing of the obesity rise roughly a decade after children, followed by a plateau or even a slight reversal in some places (e.g. Spain).
- The timing and whether the curve truly plateaued (rather than just slowed) varies by country, sex, and age group.
- In contrast, in most low‑ and middle‑income countries, adult obesity continues to rise at a stable or increasing pace, and in many cases has now surpassed prevalence levels once typical only of high‑income countries.
4. The "global epidemic" narrative hides real differences
Because obesity prevalence has risen in almost every country, it is common to describe it as a single global crisis. This study shows that:- Trajectories differ substantially between countries
- They differ by age group (children vs adults)
- They differ by sex
Possible explanations
The authors do not claim to prove exact causes, but they suggest that the divergent patterns likely reflect differences in:- Food systems: availability, affordability, and marketing of energy‑dense foods
- Technological and economic trends: urbanization, sedentary work, transport patterns
- Policy environments: taxation, labeling, school meals, urban design, public health programs
- Public health campaigns
- Fiscal measures (e.g. sugar taxes)
- Changes in school food policies
- Greater awareness of healthy diets and physical activity
Implications for policy
For high‑income countries
- The plateau suggests that existing policies may have had real effects, but also that:
- Obesity remains at high levels in many places (e.g. ~20%+ in parts of the US)
- Further progress is needed to reduce prevalence, not just stop it rising. - Policymakers should focus on:
- Maintaining and strengthening food and physical activity policies
- Targeting groups where obesity remains high or rising
- Preventing a future resurgence.
For low‑ and middle‑income countries
- The accelerating trends indicate that urgent policy interventions are needed to avoid a full‑blown obesity crisis similar to what high‑income countries experienced.
- Priority areas include:
- Regulating marketing of unhealthy foods, especially to children
- Improving food labeling and transparency
- Supporting healthier school meals and active transport
- Implementing fiscal measures (e.g. taxes on sugar‑sweetened beverages)
- Building urban environments that encourage physical activity.
Strengths and limitations
Strengths
- Unprecedented scale: 232 million people, 4,050 studies, 200 countries.
- Measured data: uses objective height and weight, not self‑reports, reducing bias.
- Long time span: 1980–2024 allows analysis of decadal trends and shifts.
- Granularity: breakdowns by country, age, and sex enable nuanced insights.
Limitations
- Not all countries or years have equally dense data; some estimates rely on modeling and extrapolation.
- The study describes associations and trends, not direct causal mechanisms; explaining why trends differ requires complementary research.
- Data quality and measurement protocols vary across studies, though the collaboration applied harmonization methods to reduce this problem.
Why this study matters
This paper is a landmark because it moves beyond simplified narratives like obesity is rising everywhere to a more precise, data‑driven picture:- It shows that some countries have already turned the tide or at least stopped the rise.
- It highlights that many countries are still on a steep upward path, and in some cases accelerating.
- It provides an evidence base for designing targeted policies that match each country's reality.
