Statistics Unleashed

LeBrok

Elite member
Messages
10,261
Reaction score
1,617
Points
0
Location
Calgary
Ethnic group
Citizen of the world
Y-DNA haplogroup
R1b Z2109
mtDNA haplogroup
H1c
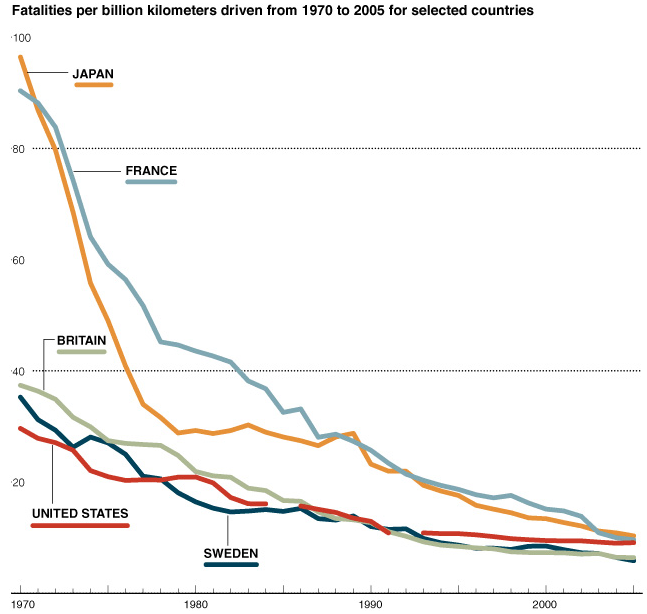
Good news! We are becoming better drivers. Or maybe we have much better and safer cars these days?

Screen%20Shot%202014-02-17%20at%205.42.48%20PM.png

http://www.theatlantic.com/internat...-most-dangerous-countries-for-drivers/283886/


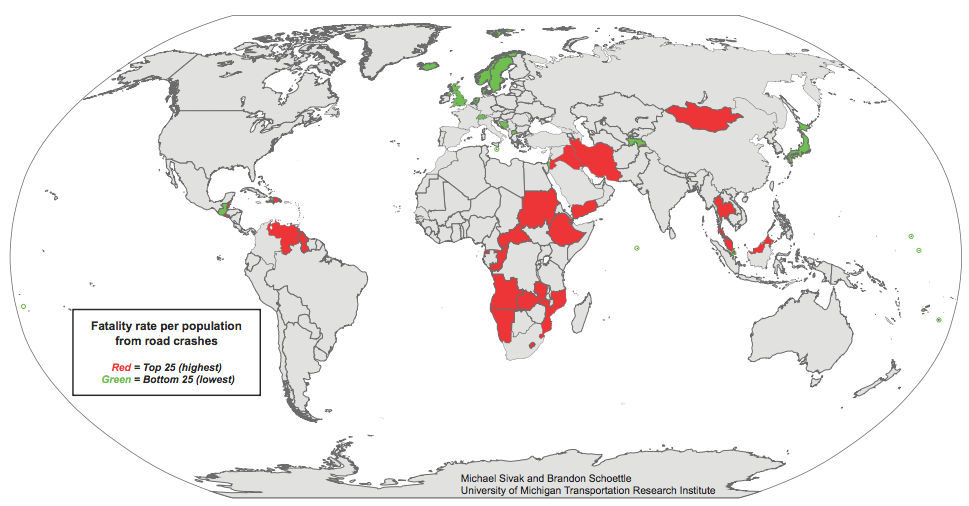
Green, who drives the best, red the worst.
Screen%20Shot%202014-02-17%20at%204.53.55%20PM.png
 
Good news! We are becoming better drivers. Or maybe we have much better and safer cars these days?
I`m going to say, based on what I have seen of the driving skills in my particular patch of the woods, it has to be that cars are better. The driving I see on a daily basis is, in my opinion, very poor..it`s almost like, engine on, brain function off. If I get time I must look to see if I can find statistics regarding road accidents here.
 
I`m going to say, based on what I have seen of the driving skills in my particular patch of the woods, it has to be that cars are better. The driving I see on a daily basis is, in my opinion, very poor..it`s almost like, engine on, brain function off. If I get time I must look to see if I can find statistics regarding road accidents here.
My sentiment exactly, most people here drive like in half sleep. Zombies live among us!
 
Who is oldest in Europe?

Germany and Italy have most aged population. Albanians and Macedonians the youngest.

Percentage of the population over 65 in Europe

Europe_population_over_65.png


http://en.wikipedia.org/wiki/Ageing_of_Europe


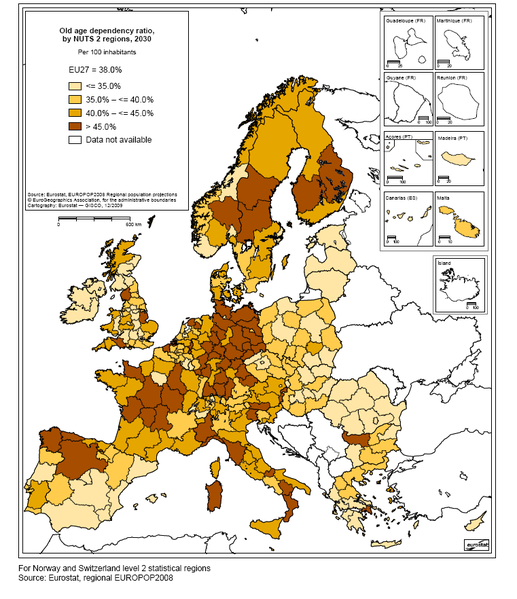
[FONT=open_sansregular]The [/FONT]old-age-dependency ratio[FONT=open_sansregular] is used as an indicator of the extent to which the older population (65 years or over) must be supported by the population of working age (conventionally 15-64 years old).
[/FONT]
I guess it presents not only amount of old people but old poor people.

517px-Old_age_dependency_ratio_by_NUTS_2_regions%2C_2030.PNG


http://ec.europa.eu/eurostat/statis..._dependency_ratio_by_NUTS_2_regions,_2030.PNG
 
Back
Top