Tomenable
Well-known member
- Messages
- 6,030
- Reaction score
- 1,753
- Points
- 113
- Location
- Poland
- Ethnic group
- Polish
- Y-DNA haplogroup
- R1b-L617
- mtDNA haplogroup
- W6a
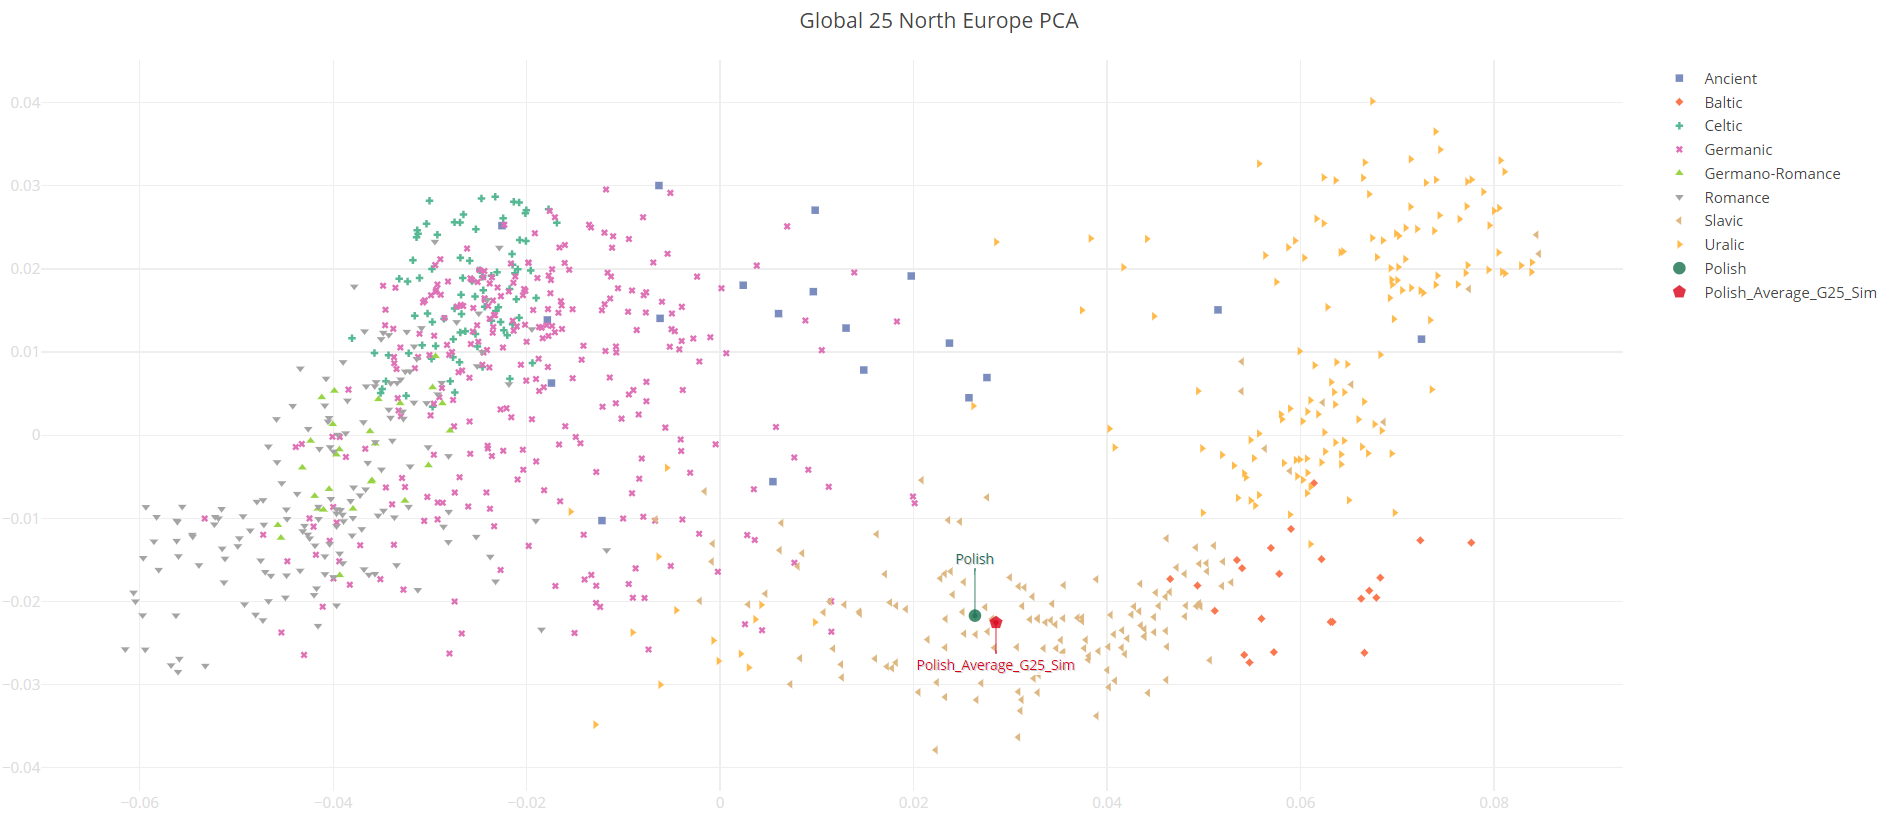
I calculated this average based on data from the 1950 census about places of origin of population in 1939.
(I checked also where ethnic Polish people lived in 1910, and percentages for most regions were similar)
I used Eurogenes K36 to simulate Global25 coordinates.
Origin in 1950 (based on residence in 1939) -> weight -> genetic region used to represent this population
City Warsaw -> 909026 (3.7%) -> PL_Central-Poland:Warsaw
Warsaw Voivodeship -> 2448137 (10.1%) -> PL_Mazowieckie
Bydgoszcz Voivodeship -> 1587480 (6.6%) -> PL_Kujawsko-Pomorskie
Poznan Voivodeship -> 2320323 (9.6%) -> PL_Wielkopolskie
Lodz V. and City Lodz -> 2166072 (8.9%) -> PL_Lodzkie
Kielce Voivodeship (Kielce) -> 1094404 (4.5%) -> PL_Swietokrzyskie
Kielce Voivodeship (Radom) -> 882339 (3.6%) -> PL_Radom
Lublin Voivodeship -> 1810437 (7.5%) -> PL_Lubelskie
Bialystok Voivodeship -> 1038112 (4.3%) -> PL_Podlaskie
Olsztyn V. and Bialystok ZO -> 227229 (0.9%) -> PL_Warmia-Masuria
Gdansk Voivodeship -> 560525 (2.3%) -> PL_Pomorskie-Kashubia*
Koszalin Voivodeship -> 48899 (0.2%) -> PL_Pomorskie-Slovincians
Wroclaw Voivodeship -> 93987 (0.4%) -> PL_Upper-Silesia**
Cieszyn Silesia -> 253169 (1.0%) -> PL_Cieszyn-Silesia
Upper Silesia -> 2014879 (8.3%) -> PL_Upper-Silesia
Katowice V. Lesser Polish part -> 700628 (2.9%) -> PL_Malopolskie
Cracow Voivodeship -> 2326326 (9.6%) -> PL_Malopolskie
Rzeszow Voivodeship -> 1592682 (6.6%) -> PL_Podkarpackie
Szczecin Voivodeship -> 17815 (0.1%) -> PL_Pomorskie-Slovincians
Zielona Gora Voivodeship -> 18934 (0.1%) -> PL_Wielkopolskie***
USSR (Former Eastern Poland) -> 2137089 (8.8%) -> PL_Volhynia****
*For Gdansk Voivodeship I considered using both Kashubia and Kociewie averages, but my Kociewie average is based on a small number of samples, so I decided to use only the Kashubian average for the entire population from this region. These averages are not too different from each other anyway.
**Most of the Poles originating from Wroclaw Voivodeship were genetically like Upper Silesians, hence I used this average.
***Most of the Poles originating from Zielona Gora V. were genetically like Poles from Wielkopolskie, hence I used this average.
****For ethnic Poles from Kresy I used PL_Volhynia average which is based on 14 samples. For other regions of Kresy I have too few samples.
I counted only those people from Former Eastern Poland who settled within new borders of Poland after 1945, not those who stayed in the East.
=====
And here is the weighted average:
Polish_Average_K36
Amerindian 0.01
Arabian 0.03
Armenian 0.28
Basque 1.17
Central African 0.00
Central Euro 8.57
East African 0.00
East Asian 0.00
East Balkan 6.92
East Central Asian 0.00
East Central Euro 22.69
East Med 0.12
Eastern Euro 16.13
Fennoscandian 10.86
French 3.93
Iberian 4.86
Indo-Chinese 0.00
Italian 4.21
Malayan 0.00
Near Eastern 0.05
North African 0.03
North Atlantic 7.44
North Caucasian 0.85
North Sea 9.87
Northeast African 0.00
Oceanian 0.01
Omotic 0.01
Pygmy 0.01
Siberian 0.00
South Asian 0.02
South Central Asian 0.10
South Chinese 0.00
Volga-Ural 1.12
West African 0.00
West Caucasian 0.17
West Med 0.55
(I checked also where ethnic Polish people lived in 1910, and percentages for most regions were similar)
I used Eurogenes K36 to simulate Global25 coordinates.
Origin in 1950 (based on residence in 1939) -> weight -> genetic region used to represent this population
City Warsaw -> 909026 (3.7%) -> PL_Central-Poland:Warsaw
Warsaw Voivodeship -> 2448137 (10.1%) -> PL_Mazowieckie
Bydgoszcz Voivodeship -> 1587480 (6.6%) -> PL_Kujawsko-Pomorskie
Poznan Voivodeship -> 2320323 (9.6%) -> PL_Wielkopolskie
Lodz V. and City Lodz -> 2166072 (8.9%) -> PL_Lodzkie
Kielce Voivodeship (Kielce) -> 1094404 (4.5%) -> PL_Swietokrzyskie
Kielce Voivodeship (Radom) -> 882339 (3.6%) -> PL_Radom
Lublin Voivodeship -> 1810437 (7.5%) -> PL_Lubelskie
Bialystok Voivodeship -> 1038112 (4.3%) -> PL_Podlaskie
Olsztyn V. and Bialystok ZO -> 227229 (0.9%) -> PL_Warmia-Masuria
Gdansk Voivodeship -> 560525 (2.3%) -> PL_Pomorskie-Kashubia*
Koszalin Voivodeship -> 48899 (0.2%) -> PL_Pomorskie-Slovincians
Wroclaw Voivodeship -> 93987 (0.4%) -> PL_Upper-Silesia**
Cieszyn Silesia -> 253169 (1.0%) -> PL_Cieszyn-Silesia
Upper Silesia -> 2014879 (8.3%) -> PL_Upper-Silesia
Katowice V. Lesser Polish part -> 700628 (2.9%) -> PL_Malopolskie
Cracow Voivodeship -> 2326326 (9.6%) -> PL_Malopolskie
Rzeszow Voivodeship -> 1592682 (6.6%) -> PL_Podkarpackie
Szczecin Voivodeship -> 17815 (0.1%) -> PL_Pomorskie-Slovincians
Zielona Gora Voivodeship -> 18934 (0.1%) -> PL_Wielkopolskie***
USSR (Former Eastern Poland) -> 2137089 (8.8%) -> PL_Volhynia****
*For Gdansk Voivodeship I considered using both Kashubia and Kociewie averages, but my Kociewie average is based on a small number of samples, so I decided to use only the Kashubian average for the entire population from this region. These averages are not too different from each other anyway.
**Most of the Poles originating from Wroclaw Voivodeship were genetically like Upper Silesians, hence I used this average.
***Most of the Poles originating from Zielona Gora V. were genetically like Poles from Wielkopolskie, hence I used this average.
****For ethnic Poles from Kresy I used PL_Volhynia average which is based on 14 samples. For other regions of Kresy I have too few samples.
I counted only those people from Former Eastern Poland who settled within new borders of Poland after 1945, not those who stayed in the East.
=====
And here is the weighted average:
Code:
Polish_Average_K36,0.01,0.03,0.28,1.17,0,8.57,0,0,6.92,0,22.69,0.12,16.13,10.86,3.93,4.86,0,4.21,0,0.05,0.03,7.44,0.85,9.87,0,0.01,0.01,0.01,0,0.02,0.10,0,1.12,0,0.17,0.55Polish_Average_K36
Amerindian 0.01
Arabian 0.03
Armenian 0.28
Basque 1.17
Central African 0.00
Central Euro 8.57
East African 0.00
East Asian 0.00
East Balkan 6.92
East Central Asian 0.00
East Central Euro 22.69
East Med 0.12
Eastern Euro 16.13
Fennoscandian 10.86
French 3.93
Iberian 4.86
Indo-Chinese 0.00
Italian 4.21
Malayan 0.00
Near Eastern 0.05
North African 0.03
North Atlantic 7.44
North Caucasian 0.85
North Sea 9.87
Northeast African 0.00
Oceanian 0.01
Omotic 0.01
Pygmy 0.01
Siberian 0.00
South Asian 0.02
South Central Asian 0.10
South Chinese 0.00
Volga-Ural 1.12
West African 0.00
West Caucasian 0.17
West Med 0.55