Ιωάννης Γαβριήλ
Regular Member
- Messages
- 159
- Reaction score
- 63
- Points
- 28
- Ethnic group
- Southern European + West Sub Saharan African
- Y-DNA haplogroup
- R-Z46 / R-S47, R1b
- mtDNA haplogroup
- L2a1c1, L2
These are my results with all the ancient samples:
Distance: 0.863 (Very Good)
West African 29.6%

Continental Celtic (400 BC–200 AD) 27.4%

Bantu 16.0%
Sardinian (1640 BC–990 AD) 10.8%
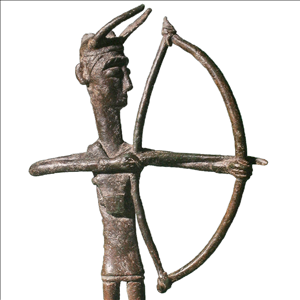
Phoenician (1000–330 BC) 6.4%

Iberian (730–100 BC) 4.4%
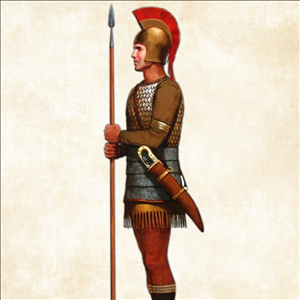
South Amerindian (1660 BC–1500 AD) 2.8%

Pygmy 1.4%
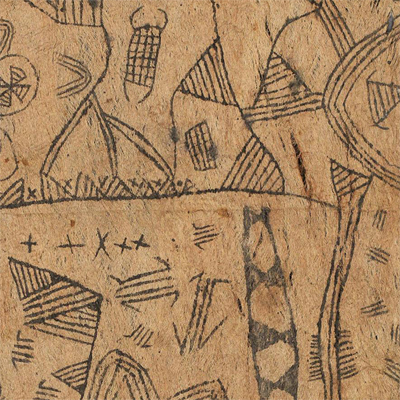
Italic and Etruscan (900–200 BC) 0.6%

Caucasian (3700–1700 BC) 0.4%

Australian (300–600 AD) 0.2%

Here're a few things to point out: all the ancient samples are selected and still no North African DNA, the Phoenician is expressive, which combined with the Iberian, indicates a connection to southern/eastern Iberia, but all of that Celtic (second biggest), points to western Iberia, the Sardinian and (very minor) Italic might indicate a Roman connection, or maybe, a Cathagenian Empire - related Sardinian migration ancestry? (I doubt it, because the sample I match is from the EMA, not Punic Sardinian) Finally, the Australian, Probably from the South Amerindian (3.0% without any oceanian sample selected), indicates a connection between South America and Oceania as we can also see in your results.
It's interesting to notice that if we add up all the western eurasian percentages (the ones related to my european ancestry) 27.4+10.8+6.4+4.4+0.6+0.4, they add up to exactly 50%.
These are the results when I take the Sardinian out:
Distance: 0.893 (Very Good)
West African 27.0%

Bantu 18.4%

Continental Celtic (400 BC–200 AD) 18.2%

Iberian (730–100 BC) 15.4%

Italic and Etruscan (900–200 BC) 8.2%

Phoenician (1000–330 BC) 8.2%

South Amerindian (1660 BC–1500 AD) 2.8%

Pygmy 1.6%

Pacific Islander (570–980 AD) 0.2%
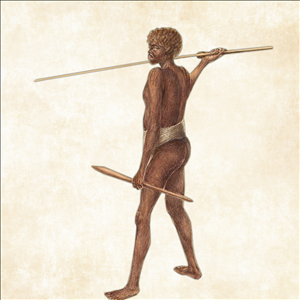
Personally, I think these are better results when compared to the ones with Sardinian, although, a little bit more distant (0.03 more), they make much more sense to me, since, not only the Iberian and Phoenician are now even more expressive, but the Celtic is less so, showing, a DNA much more inclinded to southern/central Portugal. When we analize the places where the Romans colonized, in this post:
and this post:
with the increased amount of Italic and Etruscan DNA, It's clear that we see a pattern here, it points my ancestry to southern Portugal, which makes perfect with my haplogroup, that's a branch of the one above.
Also, the Oceanian changed, from Australian to Pacific Islander, which makes even more sense, the only thing I find intriguing is the lack of North African, so common in places like Iberia
PS: The western eurasian percentages (the ones related to my european ancestry), 18.2+15.4+8.2+8.2, still add up to exactly 50%.
Distance: 0.863 (Very Good)
West African 29.6%
Continental Celtic (400 BC–200 AD) 27.4%
Bantu 16.0%

Sardinian (1640 BC–990 AD) 10.8%

Phoenician (1000–330 BC) 6.4%
Iberian (730–100 BC) 4.4%

South Amerindian (1660 BC–1500 AD) 2.8%

Pygmy 1.4%

Italic and Etruscan (900–200 BC) 0.6%

Caucasian (3700–1700 BC) 0.4%
Australian (300–600 AD) 0.2%
Here're a few things to point out: all the ancient samples are selected and still no North African DNA, the Phoenician is expressive, which combined with the Iberian, indicates a connection to southern/eastern Iberia, but all of that Celtic (second biggest), points to western Iberia, the Sardinian and (very minor) Italic might indicate a Roman connection, or maybe, a Cathagenian Empire - related Sardinian migration ancestry? (I doubt it, because the sample I match is from the EMA, not Punic Sardinian) Finally, the Australian, Probably from the South Amerindian (3.0% without any oceanian sample selected), indicates a connection between South America and Oceania as we can also see in your results.
It's interesting to notice that if we add up all the western eurasian percentages (the ones related to my european ancestry) 27.4+10.8+6.4+4.4+0.6+0.4, they add up to exactly 50%.
These are the results when I take the Sardinian out:
Distance: 0.893 (Very Good)
West African 27.0%
Bantu 18.4%

Continental Celtic (400 BC–200 AD) 18.2%
Iberian (730–100 BC) 15.4%

Italic and Etruscan (900–200 BC) 8.2%

Phoenician (1000–330 BC) 8.2%
South Amerindian (1660 BC–1500 AD) 2.8%

Pygmy 1.6%

Pacific Islander (570–980 AD) 0.2%

Personally, I think these are better results when compared to the ones with Sardinian, although, a little bit more distant (0.03 more), they make much more sense to me, since, not only the Iberian and Phoenician are now even more expressive, but the Celtic is less so, showing, a DNA much more inclinded to southern/central Portugal. When we analize the places where the Romans colonized, in this post:
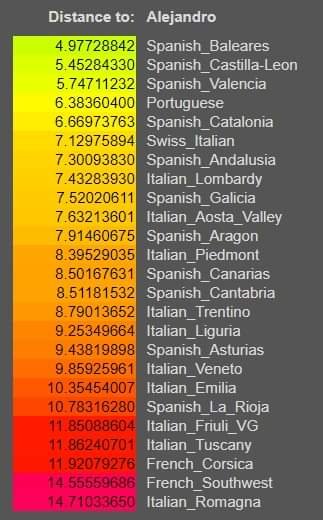
I think this might be helpful.
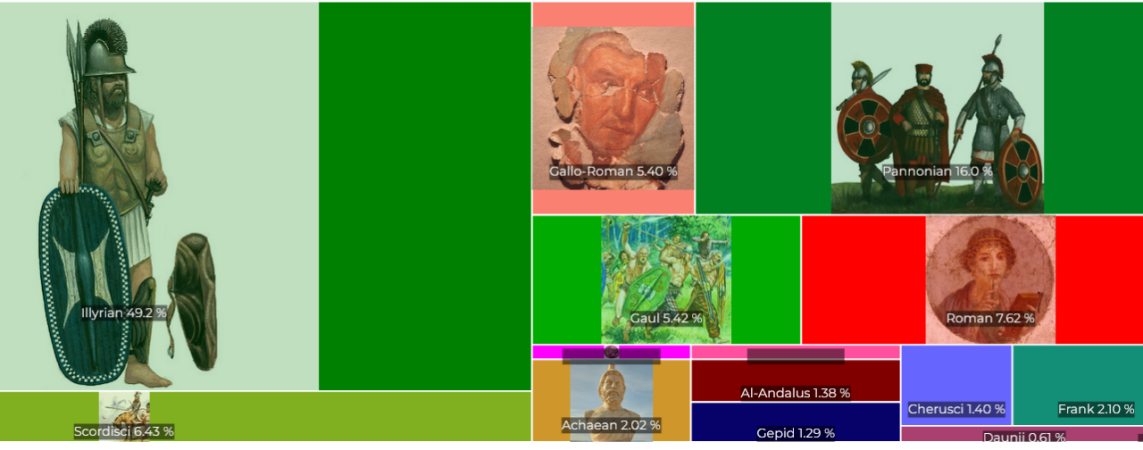
and this post:
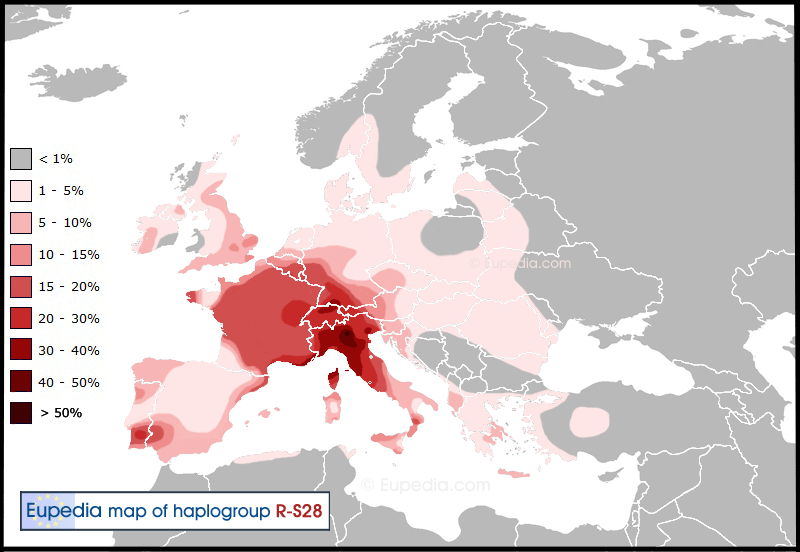
Sotty I'm late on this thread, but let's look at a more recent map of Maciamo Eupedia
with the increased amount of Italic and Etruscan DNA, It's clear that we see a pattern here, it points my ancestry to southern Portugal, which makes perfect with my haplogroup, that's a branch of the one above.
Also, the Oceanian changed, from Australian to Pacific Islander, which makes even more sense, the only thing I find intriguing is the lack of North African, so common in places like Iberia
PS: The western eurasian percentages (the ones related to my european ancestry), 18.2+15.4+8.2+8.2, still add up to exactly 50%.
Last edited:


