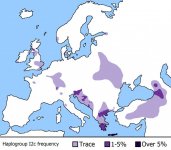
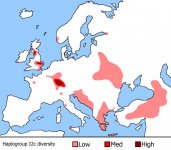
I2c frequency and diversity maps

sparkey

Great Adventurer
Messages
2,250
Reaction score
357
Points
0
Location
California
Ethnic group
3/4 Colonial American, 1/8 Cornish, 1/8 Welsh
Y-DNA haplogroup
I2c1 PF3892+ (Swiss)
mtDNA haplogroup
U4a (Cornish)
I don't expect Maciamo to make maps for the fairly rare and dispersed I2c (L596+ L597+) subclade, but as it's mine and I think it's an interesting subclade that tells some interesting stories, I decided to make a couple of rough maps myself.

Unfortunately, few studies have singled out I2c sufficiently to make good maps... so I'm relying a lot on sample-biased hobbyist data.

My major sources and their results:
Primary distribution data from I2*, new ISOGG I2b and I2c Haplogroup Project
6% in Crete per King et al 2008
4% in Kazbegi per Wells et al 2001, 0% among other Georgians
9% among Georgians per 23andMe
0% among Georgians per Litvinov et al 2010
0% among Georgians per Battaglia et al 2008
4% among Armenians per Wells et al 2001
4% among Armenians per Armenian DNA Project
non-trace levels among Emmentalers per The Swiss Anabaptist DNA Project
non-trace levels among Clan Wallace per Wallace-WALLIS Y-DNA Project

The frequency map:


The diversity map:


I am also attaching the images to this post in case the ImageShack links ever go bad:
diversityi2c.jpgfrequencyi2c.jpg
 
Last edited:
Well, at least you're providing some kind of sources, I'll give you credit just for that since it seems like an ethical approach :good_job:

Though I agree with you, being from rare lineages makes it tough to come up with some sort of conclusion, what did you use to make the maps btw?
 
Well, at least you're providing some kind of sources, I'll give you credit just for that since it seems like an ethical approach :good_job:

Though I agree with you, being from rare lineages makes it tough to come up with some sort of conclusion, what did you use to make the maps btw?

I just used MS Paint actually... since it was only three shades it wasn't difficult to just do approximations with the few data points I had. The original map had national borders that were helpful to plot the data points accurately, but I removed them to keep the geographical flow (just realized that I missed the N. Ireland border, whoops).
 
Great job! How old is I2c?

What stories tells this subclade according to you?

Maybe it was part of the ancient Hittites from Europe who settled in Asia Minor?


Edit: changed J2c in I2c!
 
Great job! How old is J2c?

I2c you mean? It's between ~7,000 (its approximate TMRCA) and ~12,500 (its approximate TMRCA with I2b-ADR) years old. Its distribution in its lower diversity areas are going to be explained by much younger migrations, though.

What stories tells this subclade according to you?

Well I suppose I should say that it has the potential to tell a lot of stories. It may be the best subclade for tracing certain European backmigrations into Asia. It has a couple of interesting apparent expansions in Western Europe, namely within the Brythonic area of Scotland and into the Emmental in Switzerland. It had a major expansion on Crete. How all these happened could be quite interesting to investigate.

Maybe it was part of the ancient Hittites from Europe who settled in Asia Minor?

Well most of the data points in Asia I had to work with were from ethnic Armenians, and I'm not sure how they got it. Another note is that most of the Eastern Europeans with I2c are ethnic Jews.
 
Thank you.

Before WW1 many Armenians lived in NorthEast Anatolia, above Lake Van.
 
Nice maps. The presence of I2c in the Caucasus as well as in the south Germany/Alpine region makes me wonder if it might have spread with G2a at some point.
 
Great job Sparkey! Now we are going to expect more from you... :grin:
 
Nice maps. The presence of I2c in the Caucasus as well as in the south Germany/Alpine region makes me wonder if it might have spread with G2a at some point.

With me, haithabu, and Kardu all posting recently, I2c people are represented here!

The fact that both Germany and England have all three major clusters and the fact that only one cluster is present east of Central Europe (see the diversity map) makes it pretty clear that there isn't a real East-to-West spread, at least outside of the B cluster that spreads into Asia. I really don't see a correlation between the A and C clusters and G2a, and B is pretty young.
 
Last edited:
Nice work Sparkey. It is interesting that the traces are very spread over a wide area and each section completely isolated from the next. Almost as if 12C parachuted into each location! lol

Is there a theory as to why Crete has the highest frequency?
 
Is there a theory as to why Crete has the highest frequency?

Well they were obviously seafaring, but we're not sure about their source. They're of the same cluster as other Eastern I2c, but seem to be a little closer to Western members of that cluster than other Eastern members (although we need more data).

Actually this comment made me revisit King et al 2008, and it looks like the Cretean spike of I2c extends to the Peloponnese a bit, but not to the rest of Greece at all. I might add a 1-5% color to the Peloponnese citing King et al 2008 if I ever update the maps, although diversity in that area should probably still be assumed to be low. The geographical target was very precise and ended up being 5.3% there.
 
Nice work . Where did you get data for east Europe and Anatolia?
 
Thanks for the map, Sparkey. How did you calculate the diversity ? Most studies do not provide STR values, so I really wonder.
 
Well they were obviously seafaring, but we're not sure about their source. They're of the same cluster as other Eastern I2c, but seem to be a little closer to Western members of that cluster than other Eastern members (although we need more data).

Actually this comment made me revisit King et al 2008, and it looks like the Cretean spike of I2c extends to the Peloponnese a bit, but not to the rest of Greece at all. I might add a 1-5% color to the Peloponnese citing King et al 2008 if I ever update the maps, although diversity in that area should probably still be assumed to be low. The geographical target was very precise and ended up being 5.3% there.

Thanks Sparkey.

It is actually not that far between Crete and the southern tip of the Peloponnese, with two islands, Antikythera and Kythera, in between the two. Fairly easy sailing from one island to the next on a good day and archaeology has shown trading etc between all 4 locations has been going on for millenia. There are also many people with Cretan ancestry settled throughout the area, so it makes perfect sense that 12C would extend to the mainland and not remain exclusively in Crete.
 
Thanks for the map, Sparkey. How did you calculate the diversity ? Most studies do not provide STR values, so I really wonder.

I2c was easy to work with in this regard, as it has three distinct major STR clusters, each with a different modal value for DYS393. So far only cluster "B" (DYS393=14) has been found in the FTDNA Project to be in Asia or Eastern Europe (including Greece), so I extrapolated that knowledge to the studies I saw. Basically, 3 clusters in an area = "high," 2 clusters = "medium," and 1 cluster = "low." Germany and England have all 3 present, Germany apparently in Southwestern Germany and England in a line from East Anglia to Northamptonshire. Scotland has 2, both in Southwestern Scotland (but none in Galloway so far). Italy and Ireland have 2 but not geographically in the same area. Everywhere else has 1 or none.
 
Updated to remove the N. Ireland border and add the Peloponnese.

Great work Sparkey! :good_job:

How long did it take to create such a map?

Not long, less than an hour of work if you're already familiar with the data. It's probably longer for Maciamo's maps that have a lot more studies to balance.
 
Nice work . Where did you get data for east Europe and Anatolia?

Eastern Europe data came entirely from the FTDNA Project. Eastern European I2c is dominated by Jews, many of whom are diaspora who have taken tests on their own. Anatolian I2c is similarly dominated by Armenians, for whom we have both hobbyist data and some studies as cited.
 
Eastern Europe data came entirely from the FTDNA Project. Eastern European I2c is dominated by Jews, many of whom are diaspora who have taken tests on their own. Anatolian I2c is similarly dominated by Armenians, for whom we have both hobbyist data and some studies as cited.
Thanks for answer
 
Updated again based on a closer look at Battaglia et al, showing 1-5% range for Greek Macedonians, Bosnian Serbs, Slovenians, and Balkarians, and 1% levels for Greeks (assuming trace in the remaining areas). Assuming that it is all B cluster because that has been the pattern.
 
Back
Top