Ancient Greeks where not modern scientists and could not perform genetic analysis. They recognized people based on their bias.
“Blacks” do exist as a social idea, but not as a genetic reality. Sub Saharan African can be seen as an ethnicity, because they share ancient ancestry. Sub Saharan Africans are genetically real. But Aboriginal Australians, Negritos, South Indians, Paleolithic and Mesolithic Europeans are genetically very distant from them. They are not part of their genetic cluster, not part of their genetic ethnicity.
The idea that people with a same trait like dark skin, blue eyes or blonde hair belong to the same “Race” or are somehow related, is an outdated idea that has no support in modern science.
It was the base for racial wars in the past and it seems that it will be in the future, because some(or many?) people are not interested in reality and place their bad claiming for vengeance over knowledge and wisdom.
If Cheddar Man is "black" because he has alleles for dark skin, I must be "black" too, because I have wild type alleles for dark eye and hair color, the same ones Archaic Humans and Sub Saharan Africans have.
As the first human genomes where sequenced, scientists found out that most alleles in all humans are the same. So they had to find a method to differentiate populations and traits. They found out that some single SNPs determined traits that differ between populations, but that was not enough to make a clear differentiation. They searched for patterns of alleles in SNPs that where common for a population and based on this, ancestry can be determined.
Cheddar Man does not share a large amount of unique DNA with Sub Saharan Africans, but with Europeans:
Eurogenes K36 results:
32.26% Fennoscandian
24.48% North_Sea
16.45% East_Central_Euro
10.70% Eastern_Euro
9.41% North_Atlantic
6.69% Basque
If he would be of ancient African ancestry, he must have at least 30% Pygmy component.
Population Oracles from Gedmatch for Cheddar Man:
MDLPK16
[TABLE="width: 232"]
[TR]
[TD="width: 33"]
#
[/TD]
[TD="width: 129"]
Population[/TD]
[TD="width: 58"]
Percent
[/TD]
[/TR]
[TR]
[TD="width: 33"]
1
[/TD]
[TD="width: 129"]NorthEastEuropean[/TD]
[TD="width: 58"]
72.46
[/TD]
[/TR]
[TR]
[TD="width: 33"]
2
[/TD]
[TD="width: 129"]Neolithic[/TD]
[TD="width: 58"]
25.2
[/TD]
[/TR]
[TR]
[TD="width: 33"]
3
[/TD]
[TD="width: 129"]Steppe[/TD]
[TD="width: 58"]
1.19
[/TD]
[/TR]
[TR]
[TD="width: 33"]
4
[/TD]
[TD="width: 129"]Australian[/TD]
[TD="width: 58"]
0.53
[/TD]
[/TR]
[TR]
[TD="width: 33"]
5
[/TD]
[TD="width: 129"]Subsaharian[/TD]
[TD="width: 58"]
0.44
[/TD]
[/TR]
[TR]
[TD="width: 33"]
6
[/TD]
[TD="width: 129"]Oceanic[/TD]
[TD="width: 58"]
0.15
[/TD]
[/TR]
[TR]
[TD="width: 33"]
7
[/TD]
[TD="width: 129"]Ancestor[/TD]
[TD="width: 58"]
0.03
[/TD]
[/TR]
[TR]
[TD="width: 33"]
8
[/TD]
[TD="width: 129"]Amerindian[/TD]
[TD="width: 58"]
0.01
[/TD]
[/TR]
[/TABLE]
[TABLE="width: 341"]
[TR]
[TD="width: 43"]
#
[/TD]
[TD="width: 222"]
Population (source)[/TD]
[TD="width: 65"]
Distance
[/TD]
[/TR]
[TR]
[TD="width: 43"]
1
[/TD]
[TD="width: 222"]Finn (Finland)[/TD]
[TD="width: 65"]
39.01
[/TD]
[/TR]
[TR]
[TD="width: 43"]
2
[/TD]
[TD="width: 222"]Latvian (Latvia)[/TD]
[TD="width: 65"]
39.33
[/TD]
[/TR]
[TR]
[TD="width: 43"]
3
[/TD]
[TD="width: 222"]Latvian_Dobele (Dobele)[/TD]
[TD="width: 65"]
39.45
[/TD]
[/TR]
[TR]
[TD="width: 43"]
4
[/TD]
[TD="width: 222"]Estonian (Estonia)[/TD]
[TD="width: 65"]
39.65
[/TD]
[/TR]
[TR]
[TD="width: 43"]
5
[/TD]
[TD="width: 222"]Lithuanian (Lithuania)[/TD]
[TD="width: 65"]
40.51
[/TD]
[/TR]
[TR]
[TD="width: 43"]
6
[/TD]
[TD="width: 222"]Latvian_Cesis (Cesis)[/TD]
[TD="width: 65"]
40.6
[/TD]
[/TR]
[TR]
[TD="width: 43"]
7
[/TD]
[TD="width: 222"]Russian (Russia)[/TD]
[TD="width: 65"]
41.27
[/TD]
[/TR]
[TR]
[TD="width: 43"]
8
[/TD]
[TD="width: 222"]Vepsa (Russia)[/TD]
[TD="width: 65"]
42.19
[/TD]
[/TR]
[TR]
[TD="width: 43"]
9
[/TD]
[TD="width: 222"]Karelian (Karelia)[/TD]
[TD="width: 65"]
42.31
[/TD]
[/TR]
[TR]
[TD="width: 43"]
10
[/TD]
[TD="width: 222"]Saami_WGA (Lapland)[/TD]
[TD="width: 65"]
42.39
[/TD]
[/TR]
[/TABLE]
DodecadK12b
[TABLE="width: 224"]
[TR]
[TD="width: 33"]
#
[/TD]
[TD="width: 122"]
Population[/TD]
[TD="width: 58"]
Percent
[/TD]
[/TR]
[TR]
[TD="width: 33"]
1
[/TD]
[TD="width: 122"]North_European[/TD]
[TD="width: 58"]
69.96
[/TD]
[/TR]
[TR]
[TD="width: 33"]
2
[/TD]
[TD="width: 122"]Atlantic_Med[/TD]
[TD="width: 58"]
29.74
[/TD]
[/TR]
[TR]
[TD="width: 33"]
3
[/TD]
[TD="width: 122"]Sub_Saharan[/TD]
[TD="width: 58"]
0.24
[/TD]
[/TR]
[TR]
[TD="width: 33"]
4
[/TD]
[TD="width: 122"]East_African[/TD]
[TD="width: 58"]
0.05
[/TD]
[/TR]
[/TABLE]
[TABLE="width: 341"]
[TR]
[TD="width: 43"]
#
[/TD]
[TD="width: 222"]
Population (source)[/TD]
[TD="width: 65"]
Distance
[/TD]
[/TR]
[TR]
[TD="width: 43"]
1
[/TD]
[TD="width: 222"]Swedish (Dodecad)[/TD]
[TD="width: 65"]
14.36
[/TD]
[/TR]
[TR]
[TD="width: 43"]
2
[/TD]
[TD="width: 222"]Polish (Dodecad)[/TD]
[TD="width: 65"]
15.06
[/TD]
[/TR]
[TR]
[TD="width: 43"]
3
[/TD]
[TD="width: 222"]Norwegian (Dodecad)[/TD]
[TD="width: 65"]
16.95
[/TD]
[/TR]
[TR]
[TD="width: 43"]
4
[/TD]
[TD="width: 222"]FIN30 (1000Genomes)[/TD]
[TD="width: 65"]
17.03
[/TD]
[/TR]
[TR]
[TD="width: 43"]
5
[/TD]
[TD="width: 222"]Belorussian (Behar)[/TD]
[TD="width: 65"]
17.55
[/TD]
[/TR]
[TR]
[TD="width: 43"]
6
[/TD]
[TD="width: 222"]Lithuanian (Dodecad)[/TD]
[TD="width: 65"]
17.7
[/TD]
[/TR]
[TR]
[TD="width: 43"]
7
[/TD]
[TD="width: 222"]Finnish (Dodecad)[/TD]
[TD="width: 65"]
17.82
[/TD]
[/TR]
[TR]
[TD="width: 43"]
8
[/TD]
[TD="width: 222"]Lithuanians (Behar)[/TD]
[TD="width: 65"]
17.85
[/TD]
[/TR]
[TR]
[TD="width: 43"]
9
[/TD]
[TD="width: 222"]Mixed_Slav (Dodecad)[/TD]
[TD="width: 65"]
18
[/TD]
[/TR]
[TR]
[TD="width: 43"]
10
[/TD]
[TD="width: 222"]Russian (Dodecad)[/TD]
[TD="width: 65"]
18.62
[/TD]
[/TR]
[/TABLE]
Much distance to any living population, but closest to Northeast Europeans.
But we can ignore the genetic components of Cheddar Man and just look what modern populations most matches his look in trait SNPs, not ancestry:
Swede 68% United Kingdom 68% European 68%
Aboriginal Australian 63% Ukrainian 63%
All Africans 61%
Northern South Asian 60%
Dravidian 59% Middle East 59%
San 58%
Khanty 56% Native American 56%
Bantu 55%
Papuan 53%
Han Chinese 48%
He doesn't resemble any living population in a large percentage.
Its the same case like with the Tarim Mummies, some people do hard in accepting that ancient individuals often don’t fit in today's categories build by social movements and the racial Ideas of the last century.
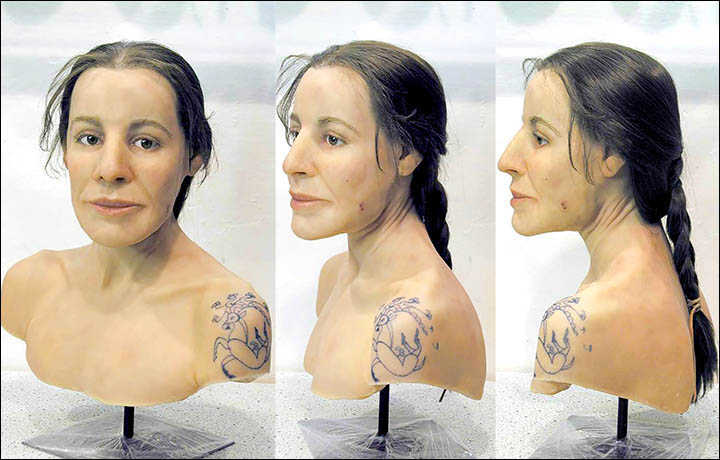
Cheddar Mans people may looked like this Aboriginal Australian + European mixed woman on the right side of the picture:
https://i.pinimg.com/originals/d8/f3/f9/d8f3f950ed05ce62dc7070e4a936c533.jpg