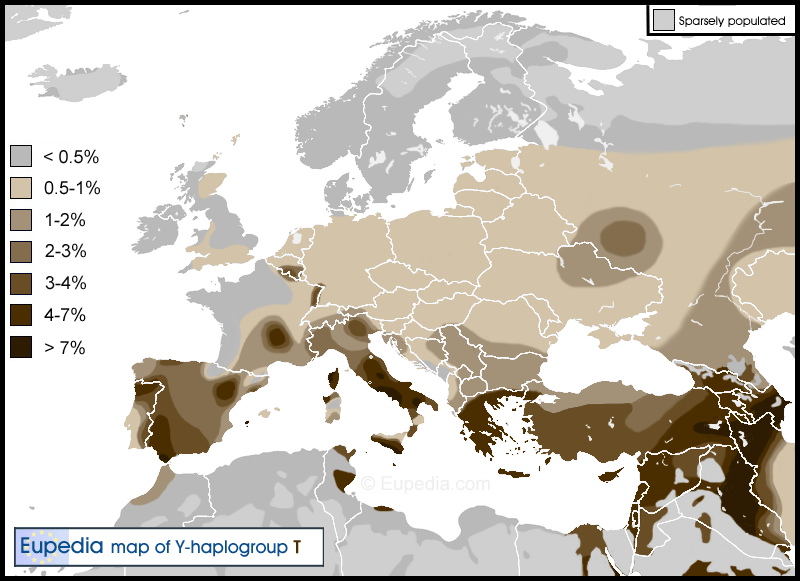
I am in a creative mood lately. After making new maps for haplogroups I1, I2b and Q, here is haplogroup T. There was already a map of hg T on Wikipedia (from which I got a little inspiration), but I didn't like it because it didn't distinguish between areas with less than 0.5%, 0.5 to 1% and 1 to 2%. That's an important distinction since T is pretty rare in Europe and rarely exceeds 5%. Another reason I didn't like the map on Wiki is that it takes percentages for point-locations with tiny sample sizes instead of making averages for the region. That's how you get ludicrous results, like an isolated peak of 17% in one Sicilian town.
Of course the map is only a rough approximation since frequencies can vary hugely from one study to another for rare haplogroups, and not all regions have reliable studies.

Of course the map is only a rough approximation since frequencies can vary hugely from one study to another for rare haplogroups, and not all regions have reliable studies.


