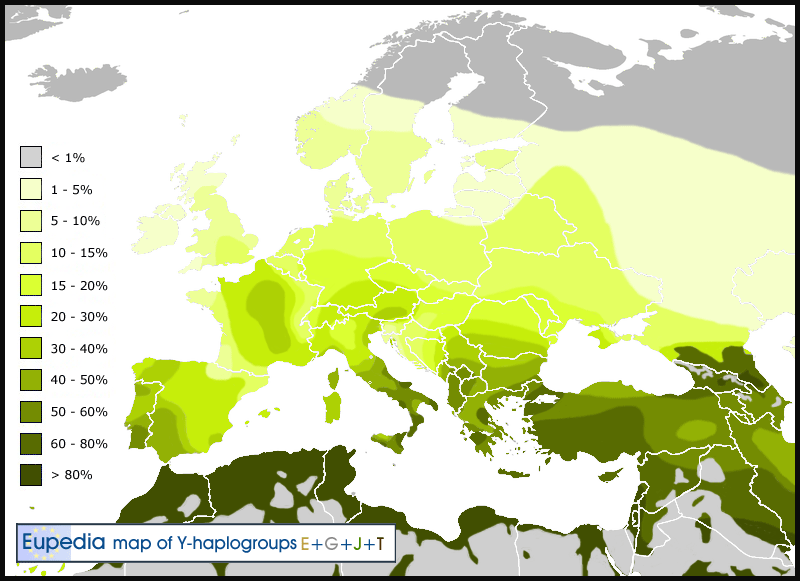
Here is the third and final map in my new series designed to show the three major components of the European population. The first map, representing all subclades of Haplogroup I, i.e. the lineages descended from the Palaeolithic and Mesolithic inhabitants of Europe. The second combined haplogroups R1a and R1b to show the impact of Indo-European migrations in the Bronze and Iron Ages.
This third map attempts to display the total percentage of Middle Eastern and North African male lineages by merging the data for haplogroups E1b1b, G, J1, J2 and T. Most of them colonised Europe from Anatolia during the Neolithic. Haplogroup J2 may have expanded from the Levant, Anatolia and Greece during the Bronze and Iron Ages, notably thanks to the Phoenician, Greek and Roman civilisations. The Greeks probably brought J2 to South Italy and Provence, while the Romans Empire contributed to the dispersal of J2 throughout the empire.

This third map attempts to display the total percentage of Middle Eastern and North African male lineages by merging the data for haplogroups E1b1b, G, J1, J2 and T. Most of them colonised Europe from Anatolia during the Neolithic. Haplogroup J2 may have expanded from the Levant, Anatolia and Greece during the Bronze and Iron Ages, notably thanks to the Phoenician, Greek and Roman civilisations. The Greeks probably brought J2 to South Italy and Provence, while the Romans Empire contributed to the dispersal of J2 throughout the empire.

Last edited:

