Author: Maciamo Hay.
Introduction
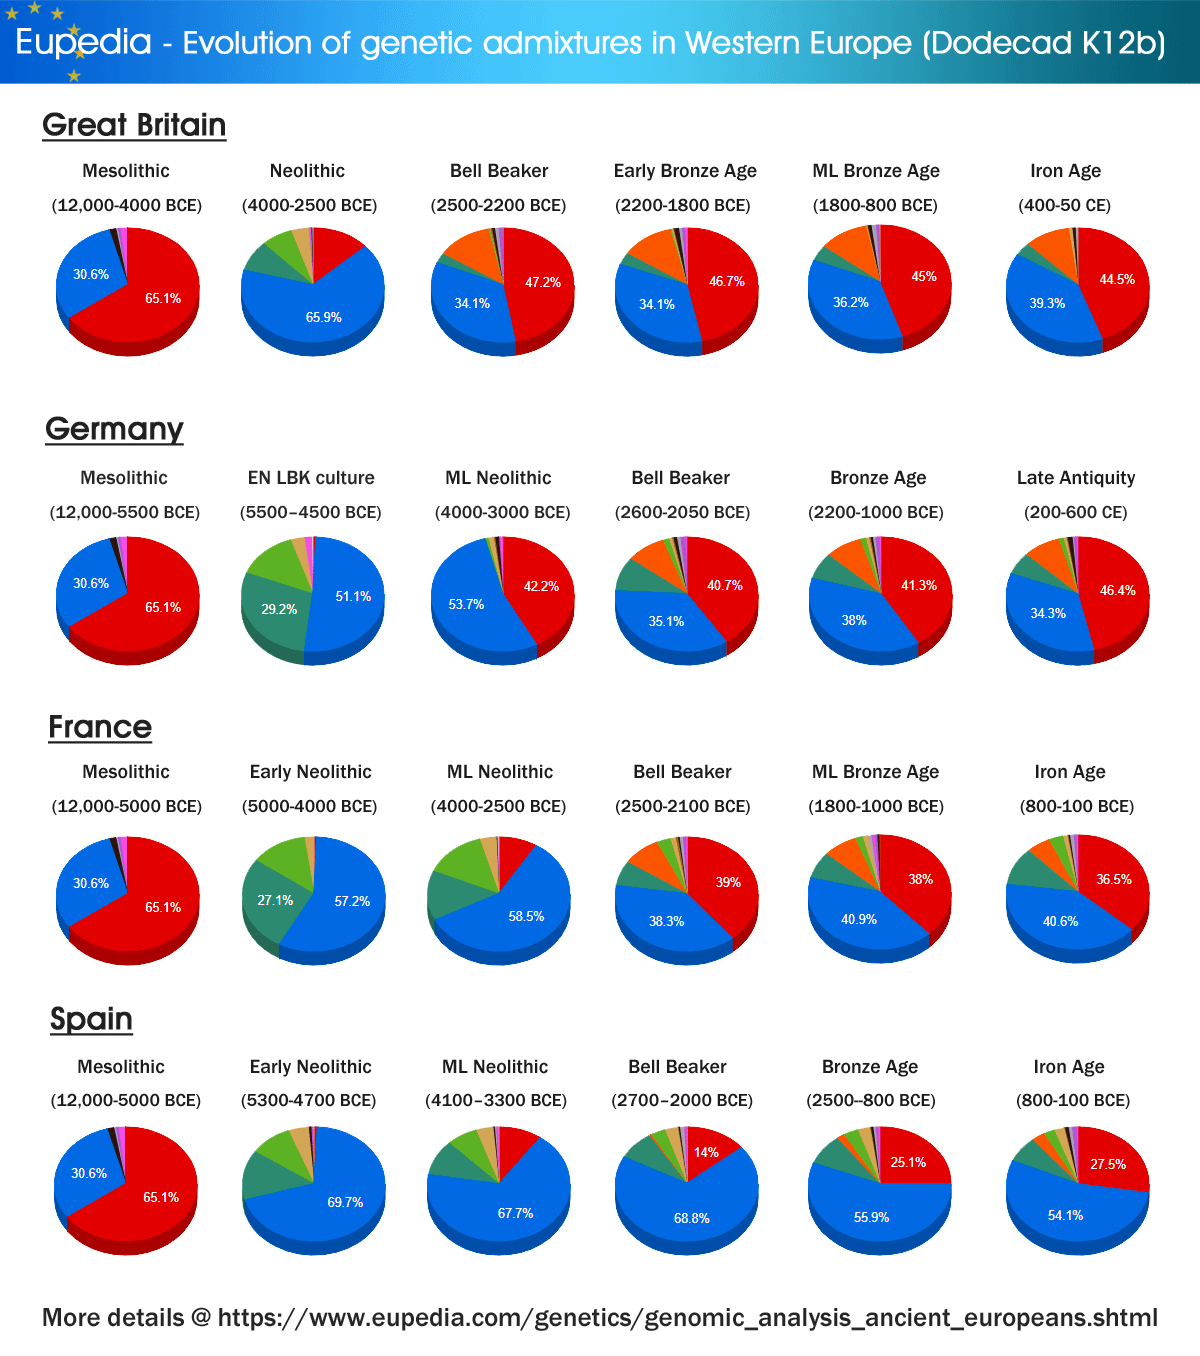
Y-chromosomal DNA and mitochondrial DNA are useful tools to follow prehistoric population migrations. However, as uniparental markers, they have their limitations and do not inform us about the whole genome composition of individuals, which can evolve very differently due to the randomness of chromosomal recombination, natural selection for specific genes, and of course to the fact that some men can have more children with multiple women, especially in the context of highly unequal prehistoric societies. The Dodecad K12b admixture calculator used here gives estimates of the ultimate region of origin of chromosomal segments outside of the X and Y chromosomes.
This page provides a description of each K12b component with a distribution map among the present-day population. In a nutshell:
- The North European component represents mostly Mesolithic European ancestry and particularly from Northeast Europe (where it made up 80% of the K12b).
- The Atlantic Med was also found in Mesolithic South Europeans, as well as in the Eastern Mediterranean. It peaked in West European Neolithic farmers (71% in Neolithic Iberia and 66% in Neolithic Britain).
- The Caucasus more broadly originated in Greece, Anatolia and the western Caucasus. It peaked in Early Neolithic Greece (38%) and Anatolia (35%) and later even more in Minoan Greece (41%).
- The Southwest Asian matches the Levant and the Arabian peninsula. It reached 40% in the Natufians (Epipaleolithic southern Levant).
- The Northwest Africa is more broadly North Africa + Levant and was spread in part by Levantine Neolithic farmers. It was the second highest component of the Natufians (20%).
- The Gedrosia represents the region around Iran, including also Dagestan, Azerbaijan, Armenia and Pakistan. It was found in Early Neolithic Iran (64%) and among the Steppe pastoralists of the Yamna culture (27%), whose descendants expanded across most of Europe during the Bell Beaker period and the Bronze Age.
- The East Asian, Southeast Asian and Siberian components are usually found together. They represent Paleolithic Siberian ancestry, already found in Northeast Europe in the Mesolithic, as well as a more recent migration that originated in Neolithic China. As the speakers of Altaic and Uralic languages, North Chinese Neolithic farmers/herders colonised Mongolia and Siberia and eventually reached Northeast Europe by the Bronze Age.
- The Sub-Saharan Africa (SSA) is actually more of an "other" category. For example, running Neanderthal genomes in the Dodecad K12b gives overwhelmingly Sub-Saharan Africa results, even though Neanderthal were never present in Sub-Saharan Africa. It's also highly unlikely that some ancient North European or Siberian populations possessed over 1% of (recent) SSA ancestry. Note that the K12b calculator does not have an Amerindian category and other calculators have reported similar ancestry between some Siberians and Native Americans (who originated in NE Siberia), so this ancestry may also be misreported as Sub-Saharan Africa.
| Try our Ancient Ethnicities Analyzer |
|---|
|
You can compare your own genome with all the populations below using Eupedia's Ancient Ethnicities Analyzer.

|
Dodecad K12b admixtures of ancient Europeans (modal values)
The number of samples taken into account for each modal is indicated in parentheses. Click on the culture or ethnicity's name to obtain the full list of samples with individual admixtures.
Note that samples with a low genomic coverage were excluded to avoid unreliable results.
You can see the estimated ancient ancestry make-up of modern populations and a few from the Antiquity and Early Middle Ages (Latins, Gauls, Suebi, Anglo-Saxons) on this page.
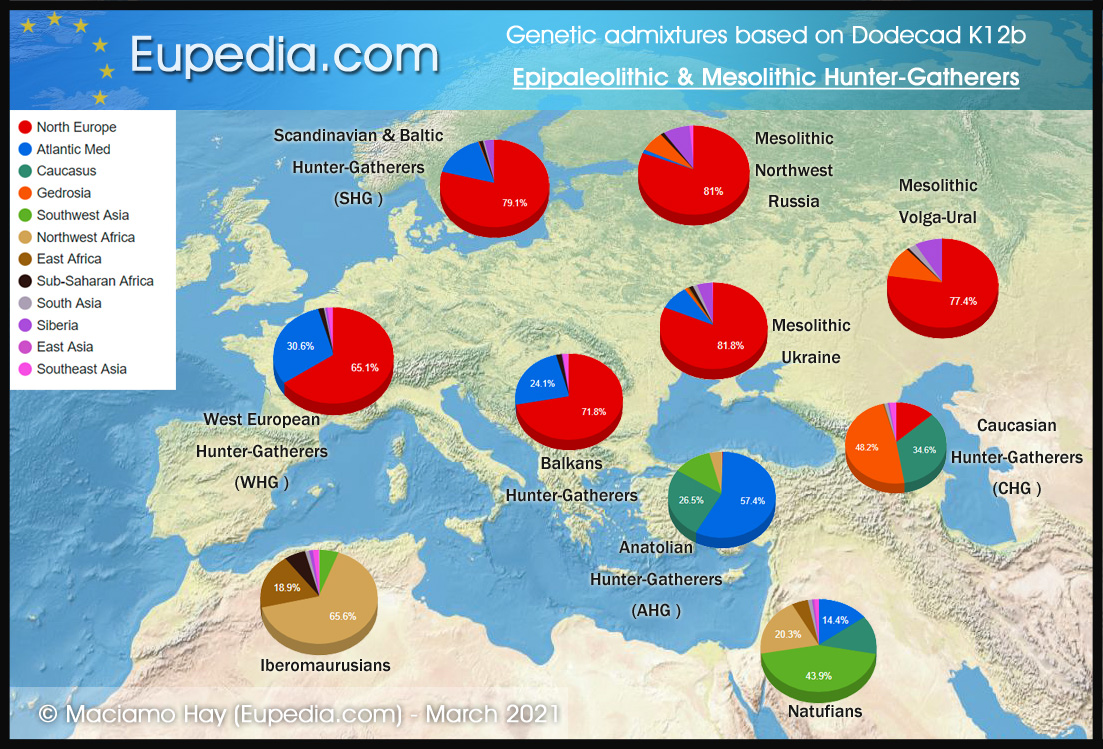
Epipaleolithic & Mesolithic Hunter-Gatherers (18,000 BCE to 4,000 BCE)
| Ethnicity |
Gedrosia |
Siberia |
NW Africa |
SE Asia |
Atlantic Med |
North Europe |
South Asia |
East Africa |
SW Asia |
East Asia |
Caucasus |
SSA |
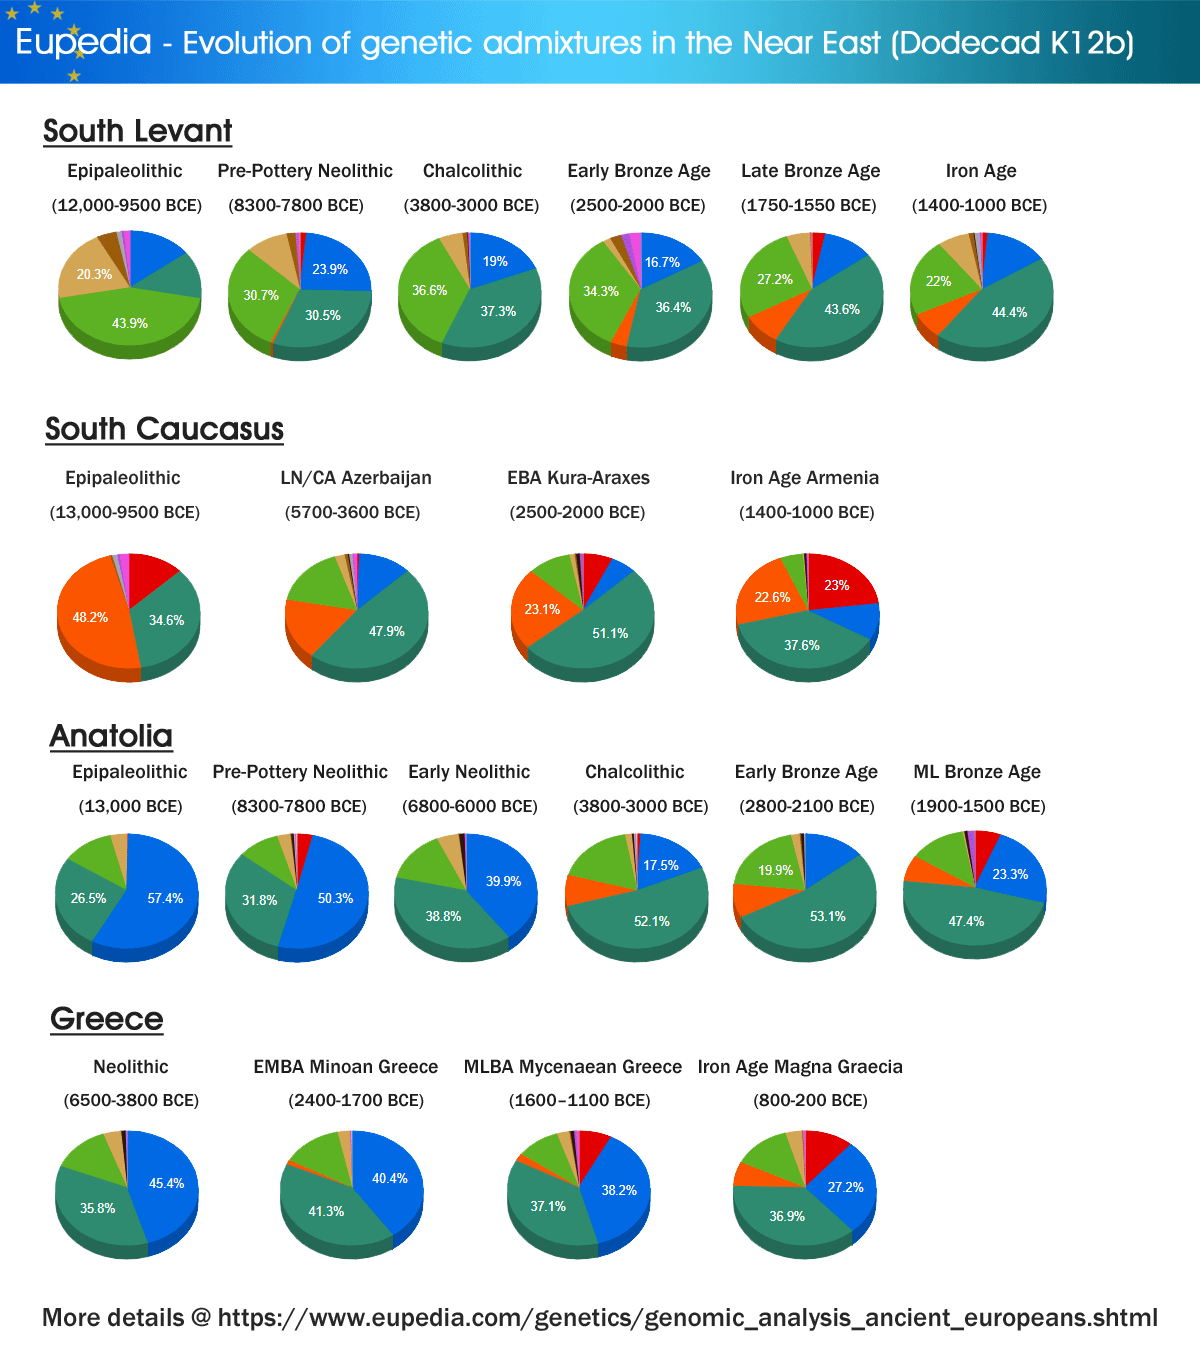
| Epipaleolithic Levant (Natufians) (n=6) |
0.00 |
0.34 |
20.28 |
1.24 |
14.41 |
0.20 |
1.19 |
4.56 |
43.91 |
0.39 |
13.48 |
0.00 |
| Epipaleolithic Magreb (Iberomaurusian) (n=5) |
0.00 |
1.08 |
65.59 |
1.69 |
0.04 |
0.06 |
1.11 |
18.93 |
5.54 |
0.05 |
0.00 |
5.90 |
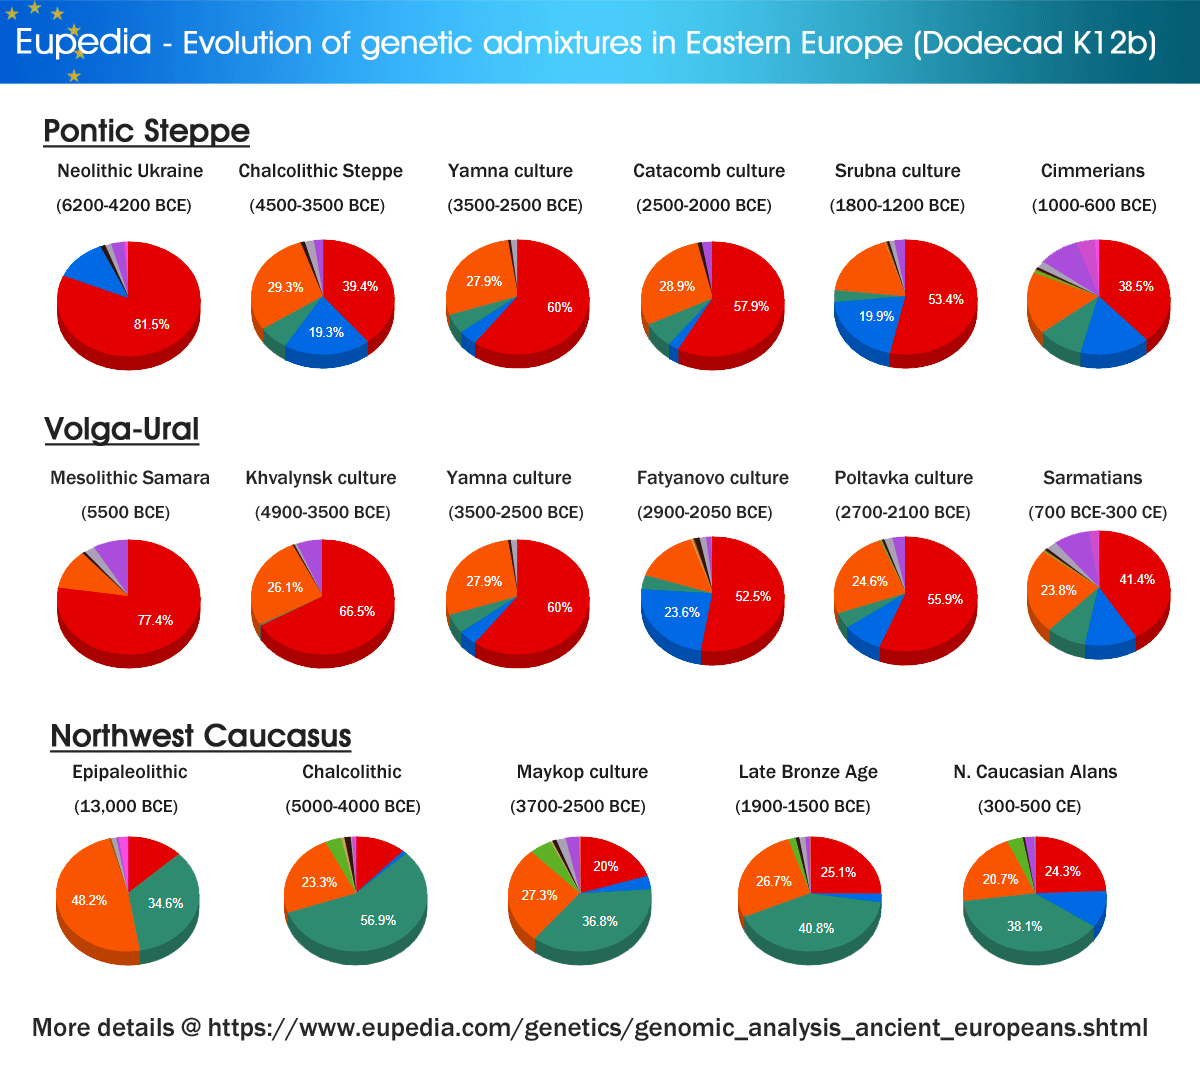
| Epipaleolithic/Mesolithic Caucasus (CHG) (n=2) |
42.18 |
0.57 |
0.00 |
0.00 |
0.00 |
4.35 |
0.28 |
0.00 |
0.00 |
0.00 |
50.61 |
2.03 |
| Mesolithic Anatolia (AHG) (n=1) |
0.00 |
0.00 |
3.77 |
0.11 |
57.42 |
0.42 |
0.00 |
0.00 |
11.78 |
0.00 |
26.51 |
0.00 |
| Mesolithic Western Europe (WHG) (n=21) |
0.00 |
0.57 |
0.00 |
0.74 |
30.90 |
65.73 |
0.38 |
0.08 |
0.00 |
0.02 |
0.00 |
1.57 |
| Mesolithic Balkans (n=43) |
0.01 |
0.37 |
0.02 |
0.35 |
24.46 |
72.81 |
0.08 |
0.02 |
0.09 |
0.07 |
0.03 |
1.71 |
| Mesolithic Sweden (SHG) (n=13) |
0.00 |
3.77 |
0.00 |
0.06 |
15.34 |
78.79 |
0.55 |
0.24 |
0.00 |
0.02 |
0.00 |
1.24 |
| Mesolithic Latvia (n=18) |
0.43 |
2.02 |
0.00 |
0.28 |
15.98 |
79.62 |
0.47 |
0.04 |
0.00 |
0.03 |
0.00 |
1.13 |
| Mesolithic Northwest Russia (n=4) |
7.23 |
7.78 |
0.00 |
1.37 |
1.40 |
81.04 |
0.09 |
0.00 |
0.00 |
0.00 |
0.00 |
1.09 |
| Mesolithic Ukraine (n=7) |
0.92 |
4.54 |
0.00 |
0.62 |
9.05 |
81.79 |
1.31 |
0.55 |
0.00 |
0.00 |
0.00 |
1.21 |
| Mesolithic Volga-Ural (n=2) |
11.27 |
8.18 |
0.00 |
0.00 |
0.00 |
77.53 |
2.39 |
0.00 |
0.00 |
0.00 |
0.00 |
0.64 |
| Late Mesolithic Comb Ceramic culture (4200-2000 BCE) (n=2) |
7.07 |
7.71 |
0.00 |
0.77 |
0.00 |
83.02 |
1.00 |
0.15 |
0.00 |
0.00 |
0.00 |
0.31 |
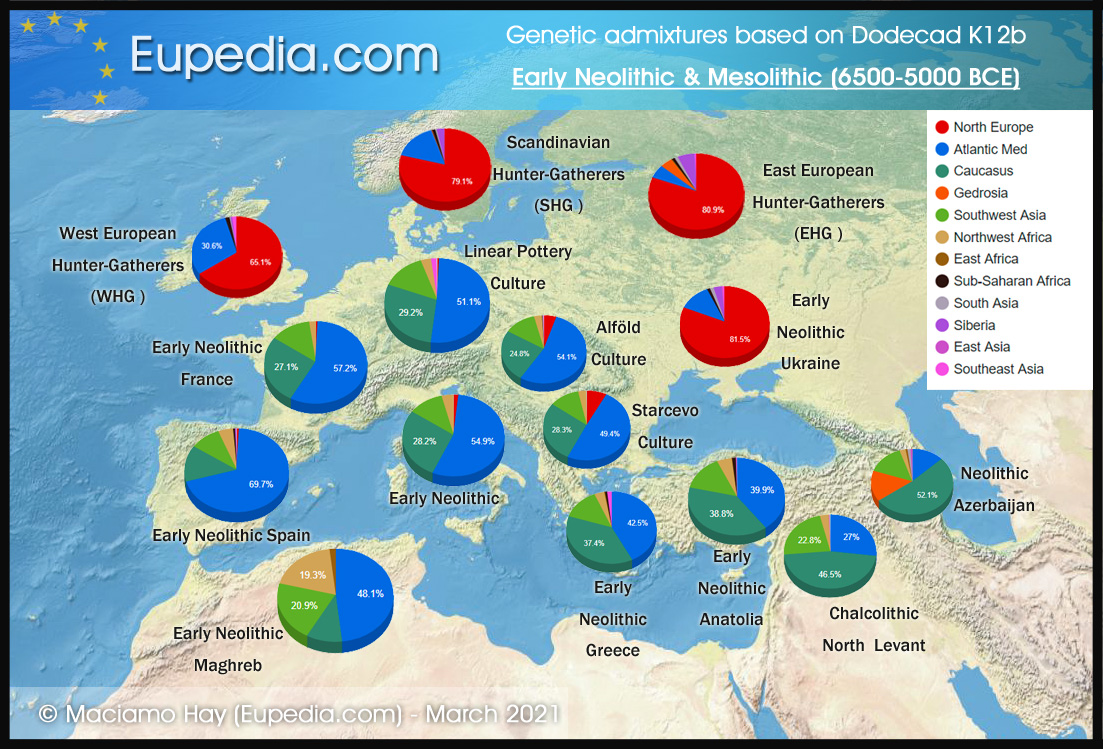
Early Neolithic Farmers (10,000 BCE to 5,000 BCE)
| Ethnicity |
Gedrosia |
Siberia |
NW Africa |
SE Asia |
Atlantic Med |
North Europe |
South Asia |
East Africa |
SW Asia |
East Asia |
Caucasus |
SSA |
| Pre-Pottery Neolithic Levant (n=15) |
0.48 |
0.09 |
9.68 |
0.10 |
23.86 |
1.59 |
0.00 |
1.98 |
30.73 |
0.94 |
30.53 |
0.00 |
| Pre-Pottery Neolithic Iran (n=6) |
64.18 |
1.82 |
0.00 |
0.00 |
0.00 |
0.81 |
5.83 |
1.02 |
3.55 |
0.68 |
15.97 |
6.15 |
| Pre-Pottery Neolithic Anatolia (n=14) |
0.00 |
0.07 |
3.47 |
0.29 |
46.01 |
2.80 |
0.20 |
0.34 |
10.91 |
0.17 |
34.74 |
1.00 |
| Early Neolithic Anatolia (n=20) |
0.03 |
0.14 |
3.39 |
0.44 |
37.92 |
0.15 |
0.00 |
0.61 |
15.91 |
0.18 |
40.32 |
0.92 |
| Early Neolithic Greece (n=3) |
0.00 |
0.00 |
3.61 |
0.49 |
43.20 |
0.00 |
0.00 |
0.00 |
13.96 |
0.00 |
37.99 |
0.76 |
| Early Neolithic Starcevo culture (n=8) |
0.00 |
0.09 |
2.99 |
0.01 |
49.42 |
7.60 |
0.00 |
0.06 |
11.36 |
0.04 |
28.32 |
0.11 |
| EN Alfold Linear Pottery culture (n=20) |
0.00 |
0.00 |
3.05 |
0.05 |
54.21 |
4.88 |
0.22 |
0.09 |
12.37 |
0.12 |
24.83 |
0.18 |
| EN LBK culture (n=43) |
0.00 |
0.02 |
3.21 |
0.09 |
51.90 |
0.72 |
0.00 |
0.12 |
14.11 |
0.07 |
29.64 |
0.13 |
| Early Neolithic Italy (n=10) |
0.00 |
0.00 |
3.77 |
0.01 |
54.90 |
1.68 |
0.00 |
0.05 |
11.33 |
0.05 |
28.23 |
0.01 |
| Early Neolithic France (n=4) |
0.00 |
0.06 |
2.12 |
0.00 |
57.21 |
0.69 |
0.00 |
0.00 |
12.87 |
0.00 |
27.06 |
0.00 |
| Early Neolithic Spain (n=10) |
0.00 |
0.32 |
4.62 |
0.13 |
69.67 |
0.81 |
0.01 |
0.05 |
9.59 |
0.15 |
14.08 |
0.58 |
| Early Neolithic Maghreb (n=1) |
0.00 |
0.00 |
19.30 |
0.00 |
48.09 |
0.17 |
0.00 |
1.77 |
20.93 |
0.00 |
9.74 |
0.00 |
| Cucuteni-Trypillian culture (n=4) |
0 |
0.00 |
2.89 |
0.11 |
51.14 |
18.29 |
1.31 |
0.34 |
7.10 |
0.00 |
19.58 |
0.00 |
| Neolithic Ukraine (n=12) |
0.11 |
3.03 |
0.00 |
0.75 |
11.68 |
81.52 |
1.26 |
0.00 |
0.00 |
0.32 |
0.00 |
1.34 |
| Neolithic Latvia (n=4) |
0.00 |
0.40 |
0.00 |
0.40 |
13.65 |
75.89 |
0.35 |
0.00 |
0.00 |
0.00 |
0.00 |
9.33 |
Middle to Late Neolithic European Farmers (5,000 BCE to 1,800 BCE)
| Ethnicity |
Gedrosia |
Siberia |
NW Africa |
SE Asia |
Atlantic Med |
North Europe |
South Asia |
East Africa |
SW Asia |
East Asia |
Caucasus |
SSA |
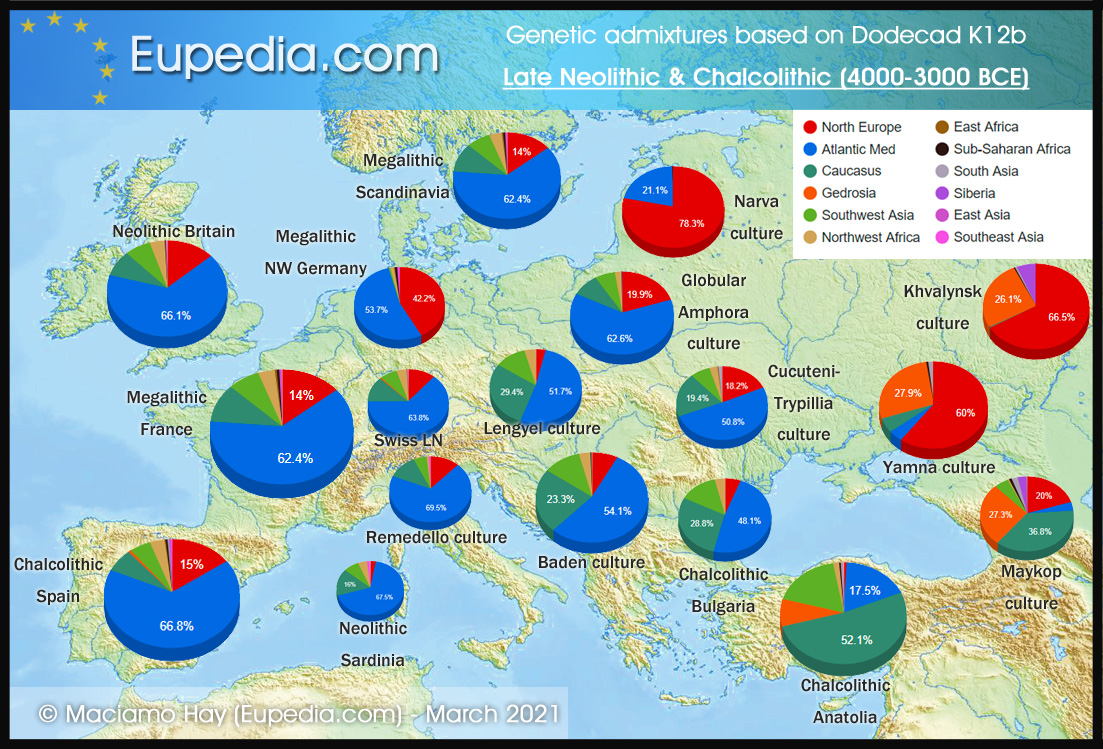
| Narva culture (n=4) |
0.00 |
0.00 |
0.00 |
0.00 |
21.15 |
78.32 |
0.06 |
0.00 |
0.00 |
0.04 |
0.00 |
0.43 |
| MN Vinca culture (n=6) |
0.00 |
0.05 |
2.99 |
0.06 |
51.34 |
0.98 |
0.14 |
0.14 |
18.20 |
0.00 |
25.77 |
0.31 |
| LN Lengyel culture (n=8) |
0.00 |
0.06 |
3.98 |
0.00 |
51.67 |
3.60 |
0.00 |
0.02 |
11.19 |
0.00 |
29.36 |
0.11 |
| LN Tisza-Sopot culture (n=11) |
0.00 |
0.01 |
2.26 |
0.19 |
53.02 |
3.15 |
0.02 |
0.00 |
13.69 |
0.30 |
27.18 |
0.19 |
| Middle Neolithic Sicily (n=10) |
0.00 |
0.00 |
3.76 |
0.00 |
55.03 |
3.82 |
0.00 |
0.07 |
11.77 |
0.00 |
25.52 |
0.03 |
| Middle Neolithic Sardinia (n=10) |
0.00 |
0.00 |
4.37 |
1.35 |
67.53 |
2.79 |
0.00 |
0.13 |
7.55 |
0.12 |
16.03 |
0.12 |
| Middle Neolithic France (n=19) |
0.00 |
0.06 |
4.04 |
0.24 |
62.41 |
9.46 |
0.05 |
0.13 |
8.41 |
0.04 |
15.02 |
0.15 |
Neolithic Britain (n=62) |
0.00 |
0.07 |
4.07 |
0.28 |
65.93 |
13.23 |
0.08 |
0.07 |
7.13 |
0.20 |
8.68 |
0.25 |
| Middle-Late Neolithic Spain (n=12) |
0.00 |
0.11 |
3.94 |
0.29 |
67.66 |
9.90 |
0.28 |
0.03 |
7.06 |
0.29 |
10.09 |
0.35 |
| Middle-Late Neolithic Portugal (n=4) |
0.00 |
0.46 |
4.19 |
0.53 |
68.23 |
11.53 |
0.02 |
0.46 |
6.58 |
0.40 |
6.92 |
0.70 |
| Late Neolithic Switzerland (n=58) |
0.52 |
0.13 |
4.08 |
0.19 |
63.95 |
11.13 |
0.03 |
0.02 |
7.00 |
0.19 |
12.71 |
0.06 |
| Megalithic Europe (n=24) |
0.00 |
0.02 |
3.77 |
0.25 |
62.37 |
13.97 |
0.05 |
0.43 |
7.32 |
0.37 |
10.86 |
0.59 |
| MN Westphalia (Megalithic Wartberg?) (n=6) |
0.00 |
0.00 |
1.29 |
0.65 |
53.72 |
42.20 |
0.00 |
0.27 |
0.68 |
0.32 |
0.00 |
0.86 |
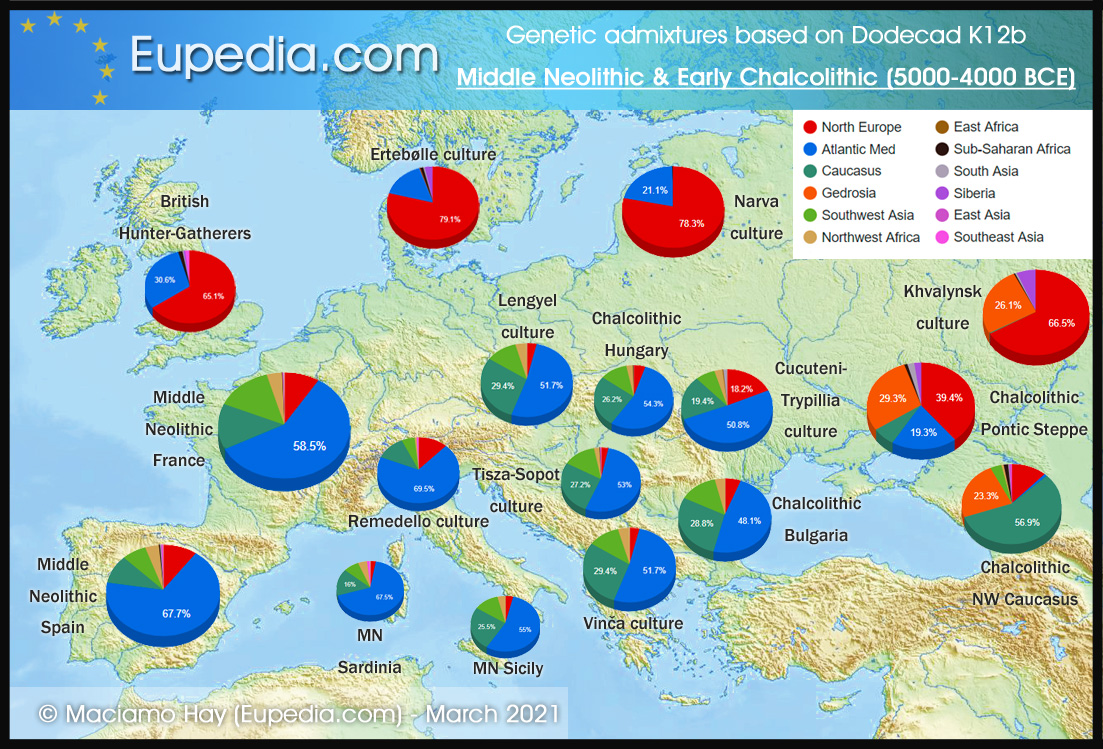
Copper Age/Chalcolithic (5,000 to 2,400 BCE)
| Ethnicity |
Gedrosia |
Siberia |
NW Africa |
SE Asia |
Atlantic Med |
North Europe |
South Asia |
East Africa |
SW Asia |
East Asia |
Caucasus |
SSA |
| Khvalynsk culture (n=3) |
26.10 |
5.95 |
0.00 |
0.15 |
0.00 |
66.48 |
0.55 |
0.00 |
0.00 |
0.00 |
0.37 |
0.40 |
| Chalcolithic Pontic Steppe (n=3) |
36.31 |
2.64 |
0.00 |
0.00 |
0.00 |
48.76 |
2.57 |
0.00 |
0.00 |
0.00 |
8.54 |
1.18 |
| Botai culture (n=3) |
20.42 |
27.26 |
0.00 |
2.16 |
0.00 |
43.87 |
4.87 |
0.00 |
0.00 |
1.31 |
0.00 |
0.11 |
| Afanasievo culture (n=5) |
24.19 |
1.31 |
0.00 |
0.03 |
9.45 |
62.36 |
0.32 |
0.07 |
0.00 |
0.04 |
1.93 |
0.28 |
| Chalcolithic Northwest Caucasus (n=3) |
23.32 |
0.00 |
0.74 |
0.31 |
0.96 |
11.65 |
0.26 |
0.00 |
3.70 |
0.70 |
56.91 |
1.44 |
| LN/Chalcolithic Azerbaijan (n=4) |
17.37 |
0.00 |
2.29 |
0.71 |
12.06 |
0.70 |
0.74 |
0.62 |
16.84 |
0.41 |
47.98 |
0.27 |
| Chalcolithic Anatolia (n=35) |
8.77 |
0.05 |
1.54 |
0.16 |
17.49 |
0.97 |
0.36 |
0.13 |
17.88 |
0.12 |
52.11 |
0.41 |
| Chalcolithic North Levant (n=6) |
0.00 |
0.00 |
3.09 |
0.12 |
26.99 |
0.00 |
0.11 |
0.00 |
22.78 |
0.26 |
46.53 |
0.13 |
| Chalcolithic South Levant (n=22) |
0.00 |
0.00 |
5.47 |
0.28 |
18.98 |
0.00 |
0.01 |
1.07 |
36.61 |
0.12 |
37.31 |
0.15 |
| Chalcolithic Bulgaria (n=9) |
0.00 |
0.00 |
3.62 |
0.03 |
48.06 |
5.72 |
0.00 |
0.00 |
13.72 |
0.00 |
28.84 |
0.01 |
| Chalcolithic Romania (n=1) |
0.00 |
0.00 |
0.00 |
0.24 |
43.99 |
53.43 |
0.00 |
0.09 |
0.00 |
0.00 |
0.00 |
2.25 |
| Remedello culture (n=3) |
0.00 |
0.00 |
0.78 |
0.71 |
69.04 |
11.78 |
0.00 |
0.00 |
5.18 |
0.00 |
11.80 |
0.72 |
| Globular Amphora culture (n=6) |
0.00 |
0.14 |
2.10 |
0.00 |
62.55 |
19.90 |
0.00 |
0.00 |
6.42 |
0.01 |
8.72 |
0.16 |
| Middle Chalcolithic Hungary (n=9) |
0.00 |
0.06 |
2.59 |
0.00 |
54.30 |
4.98 |
0.01 |
0.21 |
11.41 |
0.09 |
26.19 |
0.16 |
| Late Chalcolithic Baden culture (n=14) |
0.00 |
0.01 |
3.30 |
0.10 |
54.14 |
7.69 |
0.00 |
0.02 |
11.04 |
0.13 |
23.26 |
0.32 |
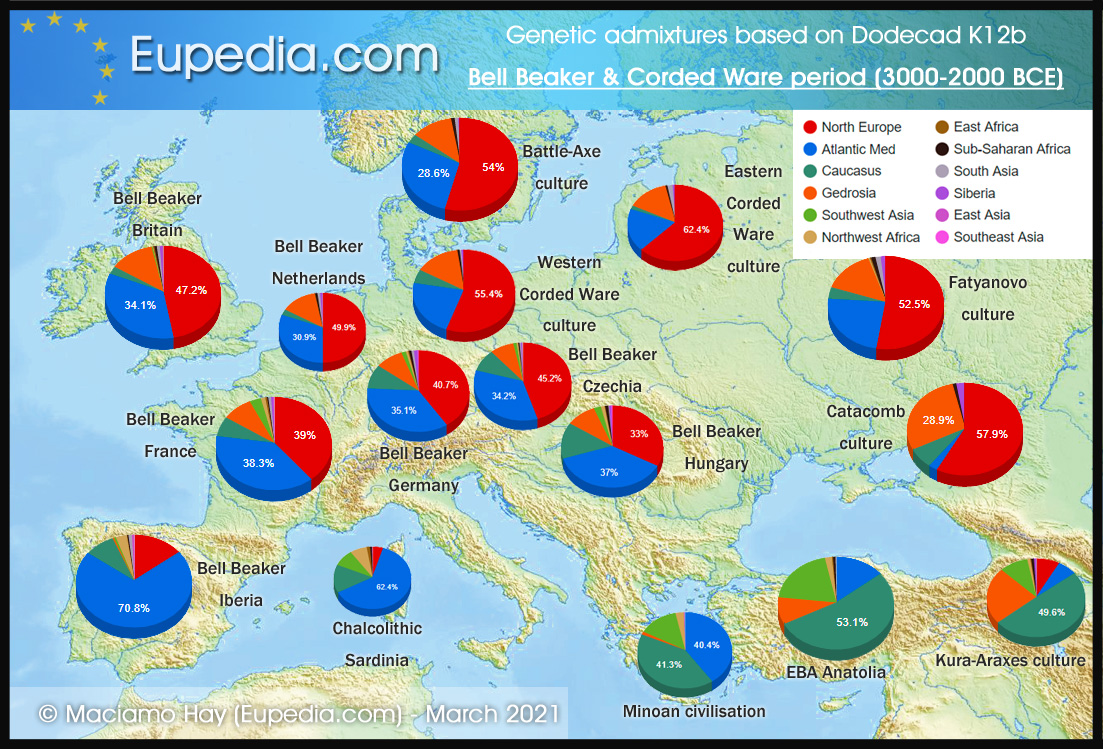
Late Neolithic/Chalcolithic Bell Beaker & Corded Ware period (3000 to 1800 BCE)
| Ethnicity |
Gedrosia |
Siberia |
NW Africa |
SE Asia |
Atlantic Med |
North Europe |
South Asia |
East Africa |
SW Asia |
East Asia |
Caucasus |
SSA |
| Chalcolithic/BB Sardinia (n=10) |
0.00 |
0.05 |
7.10 |
0.20 |
62.40 |
4.58 |
0.00 |
1.41 |
8.67 |
0.08 |
14.69 |
0.83 |
| Chalcolithic Italy (n=5) |
0.00 |
0.00 |
4.37 |
0.19 |
60.14 |
2.99 |
0.00 |
0.00 |
8.70 |
0.00 |
23.19 |
0.42 |
| Chalcolithic Spain (n=59) |
0.67 |
0.18 |
3.55 |
0.44 |
66.83 |
14.83 |
0.42 |
0.30 |
5.23 |
0.18 |
6.91 |
0.46 |
| Chalcolithic Portugal (n=11) |
0.00 |
0.67 |
4.28 |
0.45 |
65.01 |
11.91 |
0.76 |
1.21 |
5.55 |
0.48 |
8.81 |
0.86 |
| Eastern Corded Ware culture (n=14) |
16.45 |
1.20 |
0.00 |
0.00 |
17.75 |
59.38 |
1.23 |
0.38 |
0.00 |
0.00 |
2.67 |
0.94 |
| Western Corded Ware culture (n=17) |
14.35 |
0.78 |
0.06 |
0.06 |
22.27 |
55.22 |
0.50 |
0.04 |
0.15 |
0.35 |
5.47 |
0.75 |
| Battle-Axe culture (n=3) |
12.01 |
0.59 |
0.00 |
0.00 |
29.41 |
52.60 |
1.01 |
0.10 |
0.00 |
0.00 |
3.25 |
1.03 |
| Bell Beaker Czechia (n=15) |
8.03 |
0.49 |
0.54 |
0.03 |
34.19 |
45.22 |
0.45 |
0.10 |
1.12 |
0.12 |
9.28 |
0.43 |
| Bell Beaker Hungary (n=6) |
9.44 |
0.72 |
1.14 |
0.40 |
36.30 |
32.38 |
0.21 |
0.19 |
4.16 |
0.00 |
14.09 |
0.98 |
| Bell Beaker Poland (n=6) |
9.04 |
1.19 |
0.23 |
0.14 |
38.46 |
36.83 |
0.21 |
0.16 |
1.73 |
0.00 |
11.13 |
0.89 |
| Bell Beaker Bavaria/Saxony (n=20) |
8.93 |
1.10 |
0.71 |
0.27 |
35.12 |
40.72 |
0.79 |
0.30 |
1.46 |
0.17 |
9.66 |
0.78 |
| Bell Beaker Netherlands (n=7) |
13.47 |
0.91 |
0.00 |
0.04 |
30.87 |
49.92 |
1.00 |
0.17 |
0.02 |
0.01 |
2.72 |
0.86 |
| Bell Beaker Britain (n=27) |
12.57 |
0.74 |
0.15 |
0.13 |
34.10 |
47.22 |
0.84 |
0.37 |
0.31 |
0.18 |
2.76 |
0.65 |
| Bell Beaker Gaul (n=13) |
8.61 |
0.65 |
1.22 |
0.24 |
38.28 |
39.03 |
0.77 |
0.52 |
3.24 |
0.08 |
7.02 |
0.33 |
| Bell Beaker Iberia (n=11) |
0.41 |
0.03 |
2.98 |
0.14 |
68.83 |
13.98 |
0.95 |
0.15 |
3.37 |
0.53 |
8.33 |
0.31 |
Early Bronze Age (3500 BCE to 2000/1600 BCE)
| Ethnicity |
Gedrosia |
Siberia |
NW Africa |
SE Asia |
Atlantic Med |
North Europe |
South Asia |
East Africa |
SW Asia |
East Asia |
Caucasus |
SSA |
| Kura-Araxes culture (n=8) |
23.11 |
0.73 |
1.17 |
0.01 |
5.83 |
6.92 |
0.09 |
0.33 |
9.87 |
0.00 |
51.11 |
0.83 |
| Early Bronze Age Anatolia (n=4) |
9.53 |
0.00 |
1.96 |
0.09 |
14.18 |
0.00 |
0.15 |
0.32 |
19.93 |
0.06 |
53.10 |
0.68 |
| Early-Middle Bronze Age North Levant (n=9) |
8.77 |
0.00 |
3.09 |
0.37 |
12.70 |
0.24 |
0.55 |
0.54 |
26.16 |
0.13 |
47.13 |
0.31 |
| Early Bronze Age Jordan (n=3) |
3.70 |
1.96 |
1.80 |
2.59 |
16.66 |
0.07 |
0.03 |
2.56 |
34.26 |
0.00 |
36.36 |
0.00 |
| EMBA Greece (n=6) |
2.31 |
0.28 |
2.82 |
0.14 |
34.82 |
9.08 |
0.02 |
0.08 |
10.81 |
0.49 |
37.34 |
1.82 |
| Minoan Greece (n=10) |
1.24 |
0.05 |
2.80 |
0.09 |
40.35 |
0.07 |
0.00 |
0.00 |
13.79 |
0.29 |
41.27 |
0.04 |
| Maykop culture (n=16) |
27.32 |
3.15 |
0.44 |
0.11 |
3.81 |
20.03 |
2.14 |
0.10 |
5.14 |
0.02 |
36.78 |
0.95 |
| Yamna culture (n=16) |
27.42 |
2.50 |
0.00 |
0.12 |
3.38 |
57.21 |
1.90 |
0.04 |
0.00 |
0.00 |
6.77 |
0.68 |
| Fatyanovo culture (n=19) |
14.71 |
1.13 |
0.42 |
0.34 |
23.58 |
52.50 |
1.46 |
0.36 |
0.06 |
0.12 |
4.09 |
1.21 |
| Poltavka culture (n=8) |
24.61 |
3.15 |
0.00 |
0.00 |
9.02 |
55.88 |
1.84 |
0.14 |
0.36 |
0.00 |
4.47 |
0.54 |
| Catacomb culture (n=4) |
28.50 |
2.40 |
0.00 |
0.09 |
2.43 |
57.07 |
1.42 |
0.00 |
0.00 |
0.00 |
7.10 |
1.00 |
| Unetice culture (n=18) |
8.09 |
0.76 |
0.61 |
0.09 |
30.84 |
53.50 |
0.40 |
0.23 |
0.29 |
0.14 |
4.80 |
0.25 |
| Tumulus culture (n=4) |
5.46 |
0.09 |
1.28 |
0.49 |
38.88 |
40.01 |
0.78 |
0.09 |
1.86 |
0.07 |
10.16 |
0.84 |
| EBA Serbia (n=23) |
1.83 |
0.25 |
1.20 |
0.24 |
37.85 |
36.37 |
0.44 |
0.16 |
4.51 |
0.10 |
16.53 |
0.51 |
| Early Bronze Age Britain (n=28) |
11.99 |
0.65 |
0.40 |
0.43 |
34.02 |
46.75 |
0.72 |
0.21 |
0.28 |
0.08 |
3.35 |
1.11 |
| Early Bronze Age Swabia (n=24) |
7.79 |
0.63 |
1.26 |
0.44 |
40.93 |
37.99 |
0.74 |
0.22 |
1.73 |
0.26 |
7.55 |
0.45 |
| Early Bronze Age Southern France (n=5) |
1.20 |
0.35 |
0.17 |
0.37 |
50.83 |
30.77 |
0.19 |
0.78 |
2.26 |
0.00 |
12.74 |
0.33 |
| Early Bronze Age Iberia (n=7) |
3.84 |
0.22 |
2.77 |
0.76 |
54.51 |
24.30 |
0.87 |
0.24 |
3.43 |
1.00 |
7.06 |
0.99 |
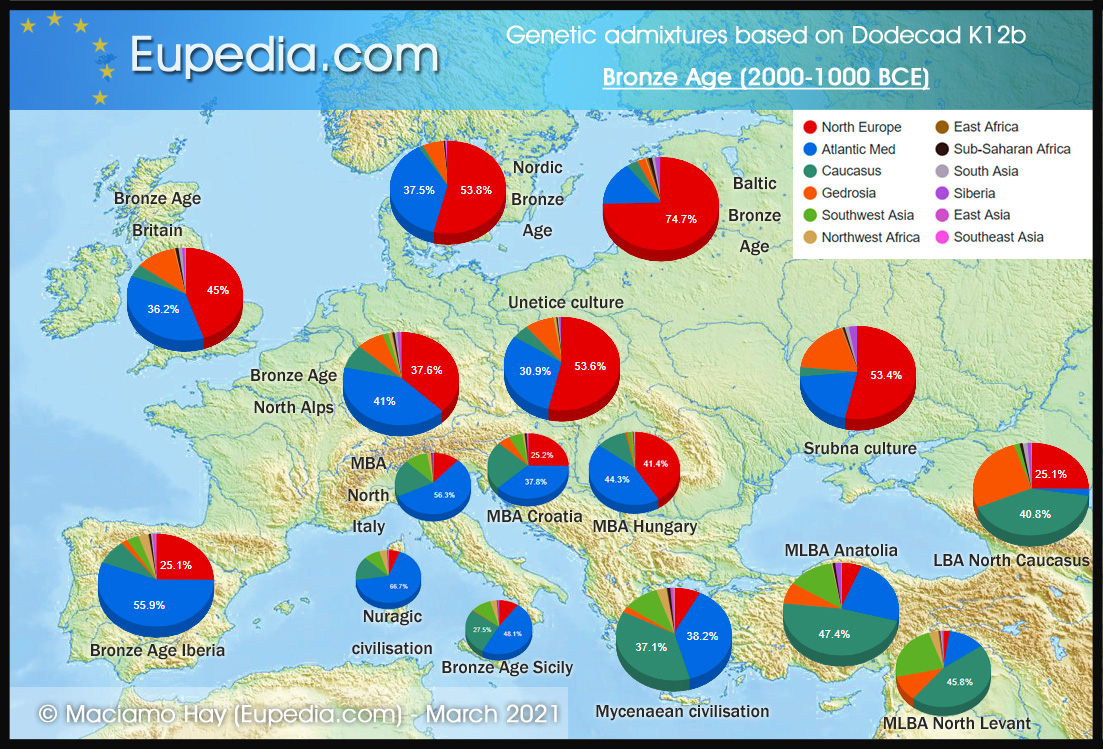
Middle to Late Bronze Age (2000/1600 BCE to 1200/500 BCE)
| Ethnicity |
Gedrosia |
Siberia |
NW Africa |
SE Asia |
Atlantic Med |
North Europe |
South Asia |
East Africa |
SW Asia |
East Asia |
Caucasus |
SSA |
| Middle-Late Bronze Age North Levant (n=24) |
11.47 |
0.21 |
3.35 |
0.20 |
12.45 |
3.12 |
0.68 |
0.45 |
22.43 |
0.21 |
45.27 |
0.15 |
| Middle Bronze Age Anatolia (n=2) |
5.22 |
0.00 |
0.00 |
0.00 |
29.43 |
3.32 |
0.00 |
0.11 |
12.40 |
0.00 |
48.94 |
0.58 |
| Middle-Late Bronze Age Hittites (n=2) |
9.37 |
3.22 |
0.80 |
0.00 |
16.48 |
8.51 |
0.00 |
0.00 |
13.03 |
3.32 |
44.46 |
0.83 |
| Mycenaean Greece (n=4) |
2.09 |
0.31 |
2.85 |
0.36 |
38.17 |
7.57 |
0.13 |
0.25 |
9.98 |
0.42 |
37.10 |
0.80 |
| Bronze Age Sicily (n=15) |
0.40 |
0.28 |
3.21 |
0.18 |
48.14 |
9.71 |
0.19 |
0.00 |
9.88 |
0.20 |
27.52 |
0.27 |
| Nuragic Sardinia (n=13) |
0.00 |
0.00 |
4.03 |
0.36 |
66.71 |
5.81 |
0.07 |
0.03 |
8.09 |
0.05 |
14.64 |
0.23 |
| Nordic Bronze Age (n=14) |
5.79 |
0.00 |
0.17 |
0.80 |
37.49 |
53.80 |
0.07 |
0.00 |
0.08 |
0.00 |
1.36 |
0.44 |
| Middle-Late Bronze Age Britain (n=24) |
11.28 |
0.63 |
0.25 |
0.18 |
36.18 |
44.97 |
1.05 |
0.14 |
0.09 |
0.04 |
4.37 |
0.82 |
| Middle Bronze Age North Alps (n=7) |
7.65 |
0.38 |
0.15 |
0.04 |
40.96 |
35.90 |
0.95 |
0.22 |
1.24 |
0.25 |
11.46 |
0.80 |
| Middle-Late Bronze Age Italy (n=9) |
1.57 |
0.27 |
2.20 |
0.48 |
51.18 |
18.07 |
0.28 |
0.02 |
7.78 |
0.13 |
17.53 |
0.49 |
| Middle-Late Bronze Age Hungary (n=12) |
0.70 |
0.00 |
0.41 |
0.02 |
44.26 |
41.40 |
0.29 |
0.11 |
1.52 |
0.12 |
10.92 |
0.25 |
| Middle-Late Bronze Age Spain (n=38) |
1.40 |
0.22 |
2.80 |
0.35 |
56.09 |
25.24 |
0.44 |
0.17 |
3.45 |
0.30 |
9.06 |
0.48 |
| Middle Bronze Age Portugal (n=4) |
0.58 |
0.14 |
3.24 |
0.53 |
57.27 |
23.19 |
0.58 |
0.01 |
5.06 |
0.35 |
8.26 |
0.79 |
| Middle Bronze Age North Caucasus (n=7) |
28.78 |
2.62 |
0.00 |
0.31 |
2.06 |
52.67 |
0.93 |
0.12 |
0.00 |
0.00 |
11.30 |
1.21 |
| Late Bronze Age North Caucasus (n=4) |
26.72 |
0.93 |
0.00 |
0.00 |
2.39 |
25.10 |
1.33 |
0.07 |
1.70 |
0.16 |
40.77 |
0.83 |
| MBA Sintashta culture (n=4) |
14.63 |
0.10 |
0.10 |
0.00 |
27.86 |
55.95 |
0.00 |
0.00 |
0.00 |
0.00 |
1.05 |
0.33
|
| MBA Andronovo culture (n=3) |
15.80 |
3.46 |
0.00 |
1.55 |
19.95 |
57.67 |
0.26 |
0.00 |
0.00 |
0.00 |
1.07 |
0.24 |
| LBA Karasuk culture (n=7) |
15.10 |
23.27 |
0.00 |
0.00 |
10.87 |
40.85 |
0.92 |
0.01 |
0.00 |
8.54 |
0.02 |
0.42 |
| LBA South Siberia (n=4) |
8.54 |
20.93 |
0.00 |
0.26 |
17.73 |
44.02 |
0.23 |
0.00 |
0.53 |
6.12 |
1.29 |
0.36 |
| LBA Srubna culture (n=27) |
18.44 |
2.39 |
0.16 |
0.24 |
19.92 |
53.42 |
1.13 |
0.31 |
0.05 |
0.03 |
3.40 |
0.52 |
| LBA Israel (n=3) |
8.72 |
0.00 |
5.40 |
0.18 |
11.54 |
3.12 |
0.00 |
0.17 |
27.17 |
0.00 |
43.57 |
0.13 |
| Baltic Bronze Age (Latvia/Lithuania) (n=12) |
2.62 |
0.66 |
0.24 |
0.36 |
15.25 |
74.50 |
1.04 |
0.56 |
0.03 |
0.00 |
3.86 |
0.88 |
| Bronze Age Estonia (n=16) |
2.02 |
2.00 |
0.48 |
0.23 |
14.95 |
74.85 |
0.57 |
0.60 |
0.05 |
0.25 |
2.92 |
1.08 |
| Bronze Age Kola peninsula (n=6) |
7.02 |
38.04 |
0.00 |
0.60 |
0.00 |
44.58 |
1.85 |
0.08 |
0.00 |
7.38 |
0.00 |
0.45 |
Iron Age (1200/500 BCE to 500 CE)
| Ethnicity |
Gedrosia |
Siberia |
NW Africa |
SE Asia |
Atlantic Med |
North Europe |
South Asia |
East Africa |
SW Asia |
East Asia |
Caucasus |
SSA |
| Early Iron Age Armenia (n=7) |
22.61 |
0.21 |
0.28 |
0.19 |
10.41 |
22.97 |
0.05 |
0.00 |
5.13 |
0.00 |
37.60 |
0.54 |
| Iron Age Israel (n=6) |
7.41 |
0.21 |
7.23 |
0.17 |
14.49 |
1.45 |
1.28 |
1.12 |
21.97 |
0.12 |
44.37 |
0.19 |
| Iron Age & Hellenistic Egypt (n=3) |
0.89 |
0.27 |
8.95 |
0.32 |
14.51 |
0.00 |
0.11 |
6.41 |
32.82 |
0.02 |
35.69 |
0.00 |
| Iron Age Iberia (n=22) |
3.02 |
0.85 |
2.28 |
0.28 |
54.07 |
27.53 |
0.82 |
0.19 |
2.53 |
0.23 |
7.39 |
0.80 |
| Italian Greeks (n=2) |
6.88 |
0.00 |
3.78 |
0.50 |
27.23 |
11.24 |
0.00 |
0.22 |
13.20 |
0.00 |
36.92 |
0.01 |
| Etruscans (n=48) |
2.01 |
0.17 |
2.58 |
0.31 |
45.20 |
23.06 |
0.24 |
0.22 |
5.97 |
0.26 |
19.55 |
0.45 |
| Villanovans (n=2) |
3.29 |
0.99 |
2.09 |
0.00 |
41.12 |
24.06 |
0.00 |
0.00 |
5.45 |
0.00 |
22.68 |
0.20 |
| Latins (n=4) |
3.10 |
0.41 |
1.38 |
0.20 |
47.83 |
24.48 |
0.40 |
0.04 |
2.68 |
0.00 |
19.26 |
0.25 |
| Hallstatt Celts (n=12) |
3.82 |
0.22 |
1.23 |
0.15 |
40.78 |
38.12 |
0.11 |
0.08 |
2.97 |
0.57 |
11.39 |
0.72 |
| La Tène Celts (n=55) |
5.92 |
0.45 |
0.68 |
0.30 |
37.25 |
40.41 |
0.36 |
0.19 |
2.21 |
0.11 |
11.34 |
0.79 |
| Iron Age Gaul Hallstatt (n=12) |
4.79 |
0.08 |
1.55 |
0.56 |
43.73 |
34.16 |
0.90 |
0.18 |
3.65 |
0.34 |
9.15 |
0.86 |
| Iron Age Gaul La Tène (n=64) |
6.01 |
0.46 |
1.13 |
0.29 |
41.99 |
37.98 |
0.47 |
0.22 |
1.69 |
0.29 |
8.78 |
0.70 |
| Iron Age Gaul Modal (n=81) |
5.74 |
0.41 |
1.20 |
0.34 |
42.15 |
37.30 |
0.53 |
0.21 |
2.13 |
0.28 |
9.00 |
0.70 |
| Iron Age Northern Gaul (n=23) |
7.41 |
0.40 |
1.38 |
0.24 |
41.08 |
38.90 |
0.28 |
0.25 |
1.20 |
0.39 |
7.70 |
0.78 |
| Iron Age Northeastern Gaul (n=38) |
5.35 |
0.41 |
1.29 |
0.35 |
39.97 |
38.16 |
0.55 |
0.28 |
2.42 |
0.18 |
10.46 |
0.55 |
| Iron Age Southern Gaul (n=15) |
4.98 |
0.29 |
0.79 |
0.45 |
47.76 |
34.31 |
0.72 |
0.05 |
2.80 |
0.45 |
6.59 |
0.81 |
| Iron Age Southeastern Gaul (n=5) |
3.31 |
0.81 |
0.96 |
0.40 |
46.83 |
32.31 |
0.86 |
0.00 |
2.24 |
0.00 |
11.16 |
1.11 |
| Early Iron Age Hungary (n=9) |
3.07 |
0.42 |
0.95 |
0.36 |
35.99 |
38.43 |
0.17 |
0.13 |
4.67 |
0.01 |
15.15 |
0.64 |
| Early Iron Age Slovenia (n=10) |
4.49 |
0.44 |
1.04 |
0.12 |
41.51 |
31.28 |
0.21 |
0.04 |
3.48 |
0.00 |
16.87 |
0.53 |
| Early Iron Age Croatia (n=9) |
5.61 |
0.12 |
0.74 |
0.35 |
39.91 |
26.99 |
0.48 |
0.17 |
4.35 |
0.12 |
20.80 |
0.36 |
| Iron Age Netherlands (n=5) |
9.86 |
0.36 |
0.12 |
0.38 |
33.68 |
46.58 |
1.41 |
0.24 |
0.43 |
0.02 |
6.70 |
0.22 |
| Early Iron Age Britain (n=37) |
8.98 |
0.52 |
0.35 |
0.34 |
40.52 |
41.38 |
0.54 |
0.31 |
0.52 |
0.17 |
5.51 |
0.85 |
| Late Iron Age Britain (n=4) |
10.07 |
0.43 |
1.14 |
0.30 |
39.11 |
42.94 |
0.34 |
0.00 |
0.20 |
0.00 |
4.64 |
0.84 |
| Iron Age Denmark (n=10) |
7.60 |
0.60 |
0.79 |
0.41 |
35.30 |
48.67 |
0.38 |
0.59 |
1.07 |
0.43 |
2.72 |
1.44 |
| Iron Age Norway (n=6) |
8.85 |
3.18 |
0.16 |
0.05 |
29.31 |
52.73 |
0.40 |
0.15 |
0.03 |
0.48 |
3.26 |
1.44 |
| Iron Age Sweden (n=4) |
8.70 |
1.18 |
0.81 |
0.26 |
33.18 |
50.44 |
0.49 |
0.72 |
1.49 |
0.00 |
0.60 |
2.13 |
| Iron Age Estonia (n=8) |
2.71 |
1.76 |
0.24 |
0.18 |
17.89 |
69.33 |
0.89 |
0.36 |
1.05 |
0.11 |
4.48 |
1.00 |
| Iron Age Finland (n=3) |
5.23 |
16.18 |
0.26 |
0.71 |
20.26 |
53.58 |
1.39 |
0.31 |
0.00 |
1.92 |
0.01 |
0.16 |
| Imperial-age Latium (East Mediterranean immigrants) (n=46) |
8.39 |
0.14 |
3.33 |
0.21 |
24.69 |
8.66 |
0.26 |
0.54 |
14.86 |
0.14 |
38.36 |
0.43 |
| Imperial-age Marche (n=2) |
8.03 |
0.24 |
2.22 |
0.79 |
30.54 |
15.60 |
0.00 |
0.00 |
10.52 |
0.00 |
32.08 |
0.00 |
Iron Age Steppe tribes (1200 BCE to 500 CE)
| Ethnicity |
Gedrosia |
Siberia |
NW Africa |
SE Asia |
Atlantic Med |
North Europe |
South Asia |
East Africa |
SW Asia |
East Asia |
Caucasus |
SSA |
| Cimmerians (n=6) |
17.57 |
9.28 |
0.00 |
1.02 |
15.41 |
38.52 |
1.99 |
0.30 |
0.79 |
4.21 |
10.27 |
0.64 |
| Western Scythians (n=28) |
11.10 |
4.19 |
1.03 |
0.96 |
23.28 |
33.27 |
0.97 |
0.60 |
3.60 |
2.63 |
17.68 |
0.71 |
| Eastern Scythians (n=12) |
18.04 |
18.04 |
0.02 |
2.33 |
6.00 |
31.64 |
3.25 |
0.36 |
0.71 |
13.47 |
5.47 |
0.68 |
| Sarmatians (n=14) |
23.82 |
8.10 |
0.15 |
0.26 |
11.53 |
41.41 |
2.40 |
0.29 |
0.18 |
2.22 |
8.97 |
0.67 |
Tian Shan Saka (n=5) |
25.93 |
13.09 |
0.11 |
0.35 |
9.74 |
35.07 |
1.32 |
0.00 |
0.00 |
7.80 |
7.67 |
0.92 |
| Tian Shan Huns (n=8) |
20.94 |
17.16 |
0.00 |
0.18 |
8.64 |
32.97 |
1.72 |
0.04 |
0.00 |
13.49 |
4.10 |
0.76 |
| Kangju/Iranian Sogdians (n=4) |
25.75 |
6.42 |
0.00 |
0.16 |
13.08 |
34.22 |
1.63 |
0.00 |
0.21 |
2.41 |
14.45 |
1.69 |
| Mongolian Xiongnu (n=5) |
8.74 |
15.47 |
0.12 |
12.81 |
2.00 |
11.56 |
1.38 |
0.00 |
0.11 |
46.40 |
0.08 |
1.31 |
| Iron Age Altai (n=5) |
14.62 |
23.01 |
0.13 |
2.97 |
7.58 |
34.88 |
0.33 |
0.00 |
0.00 |
13.80 |
2.40 |
0.30
|
| North Caucasian Alans (n=2) |
20.70 |
2.23 |
0.10 |
0.00 |
10.37 |
24.33 |
0.07 |
0.00 |
3.64 |
0.00 |
38.14 |
0.42 |
Late Antiquity & Middle Ages (300 CE to 1500 CE)
| Ethnicity |
Gedrosia |
Siberia |
NW Africa |
SE Asia |
Atlantic Med |
North Europe |
South Asia |
East Africa |
SW Asia |
East Asia |
Caucasus |
SSA |
| Roman Britain (n=8) |
10.24 |
0.15 |
0.85 |
0.14 |
37.33 |
43.76 |
0.44 |
0.23 |
0.33 |
0.17 |
5.38 |
0.97 |
| Roman & Visigothic Iberia (n=31) |
4.55 |
0.46 |
6.37 |
0.25 |
39.07 |
23.34 |
1.00 |
0.89 |
7.10 |
0.33 |
15.47 |
1.17 |
| Early Medieval Canaries (n=5) |
0.00 |
0.66 |
30.29 |
0.56 |
25.07 |
2.26 |
1.09 |
8.87 |
15.17 |
0.20 |
10.19 |
5.65 |
| Medieval Catalonia/Valencia (n=9) |
4.57 |
0.27 |
4.62 |
0.16 |
41.22 |
26.09 |
0.68 |
0.75 |
5.75 |
0.55 |
14.51 |
0.83 |
| Medieval Andalusia (n=14) |
3.62 |
0.24 |
8.84 |
0.29 |
33.69 |
15.78 |
0.81 |
3.06 |
10.12 |
0.54 |
15.98 |
7.02 |
| Late Antiquity Latium (n=24) |
6.54 |
0.21 |
3.14 |
0.20 |
32.52 |
17.92 |
0.30 |
0.46 |
10.05 |
0.10 |
28.33 |
0.25 |
| Early Medieval Latium (n=5) |
4.21 |
0.19 |
2.29 |
0.19 |
34.59 |
19.45 |
0.61 |
0.43 |
9.88 |
0.18 |
27.42 |
0.55 |
| Late Medieval Latium (n=16) |
6.43 |
0.27 |
1.77 |
0.21 |
33.12 |
24.00 |
0.33 |
0.38 |
8.11 |
0.25 |
24.71 |
0.42 |
| 6th-century Piedmont (Italians only) (n=7) |
7.98 |
0.21 |
2.80 |
0.84 |
29.83 |
14.91 |
0.61 |
0.47 |
9.99 |
2.32 |
29.77 |
0.27 |
| 6th-century Piedmont (Italians & Lombards) (n=24) |
7.80 |
0.47 |
1.40 |
0.44 |
33.46 |
32.13 |
0.37 |
0.52 |
4.87 |
0.75 |
17.44 |
0.35 |
| 8th to 12th-century Tuscany (n=10) |
5.72 |
0.06 |
2.04 |
0.37 |
32.59 |
18.68 |
0.31 |
0.20 |
9.94 |
0.14 |
29.46 |
0.50 |
| 7th/8th-century Basilicata (n=10) |
7.02 |
0.71 |
4.29 |
0.40 |
29.74 |
15.35 |
0.31 |
0.48 |
11.15 |
1.22 |
28.76 |
0.56 |
| Medieval Foggia, Apulia (n=5) |
5.89 |
0.56 |
3.82 |
0.49 |
27.97 |
19.28 |
0.19 |
0.47 |
10.48 |
0.34 |
29.06 |
1.44 |
| Suebi/Alemmani (n=20) |
8.36 |
0.62 |
0.93 |
0.34 |
32.06 |
44.48 |
0.20 |
0.31 |
1.20 |
0.40 |
5.05 |
1.06 |
| Anglo-Saxons (n=4) |
10.72 |
0.33 |
0.41 |
0.18 |
37.05 |
47.56 |
0.20 |
0.21 |
0.24 |
0.13 |
2.28 |
0.72 |
| Lombards (n=28) |
8.38 |
0.38 |
0.30 |
0.17 |
35.03 |
46.38 |
0.35 |
0.23 |
1.05 |
0.06 |
7.26 |
0.42 |
| Chernyakhiv culture/Goths (n=3) |
9.95 |
0.37 |
0.86 |
0.95 |
31.29 |
45.56 |
0.72 |
0.32 |
1.25 |
0.00 |
8.38 |
0.35 |
| Ostrogoths (n=3) |
7.92 |
2.51 |
1.82 |
1.28 |
29.31 |
39.14 |
0.73 |
0.09 |
0.86 |
1.73 |
13.41 |
1.21 |
| Danish Vikings (n=21) |
7.02 |
0.56 |
0.63 |
0.26 |
34.29 |
45.62 |
0.62 |
0.45 |
1.47 |
0.21 |
7.80 |
1.07 |
| Swedish Vikings (n=23) |
6.50 |
1.09 |
0.51 |
0.68 |
31.07 |
51.68 |
0.75 |
0.43 |
0.28 |
0.39 |
5.16 |
1.46 |
| 10th/11th-century Vikings from England (n=28) |
8.40 |
0.72 |
0.57 |
0.71 |
35.30 |
46.60 |
0.31 |
0.30 |
0.91 |
0.11 |
4.17 |
1.91 |
| 10th/13th-century Vikings from Poland (n=9) |
4.35 |
0.31 |
0.69 |
0.38 |
27.39 |
55.13 |
0.42 |
0.34 |
0.82 |
0.21 |
8.68 |
1.28 |
| 10th/13th-century Vikings from Russia (n=15) |
5.28 |
1.54 |
0.22 |
0.56 |
27.39 |
53.31 |
0.70 |
0.81 |
1.57 |
0.80 |
6.76 |
1.07 |
| 10th/13th-century Vikings from Ukraine (n=4) |
4.39 |
1.94 |
0.57 |
0.64 |
26.14 |
53.36 |
0.10 |
0.10 |
0.98 |
0.22 |
9.95 |
1.63 |
| Avars (n=2) |
4.96 |
1.09 |
0.11 |
0.00 |
24.45 |
55.08 |
0.69 |
0.34 |
1.38 |
0.00 |
11.68 |
0.23 |
| Early Medieval Czechia (n=2) |
0.92 |
0.00 |
0.27 |
0.00 |
27.17 |
65.15 |
0.00 |
0.00 |
0.19 |
0.00 |
6.29 |
0.03 |
| Medieval Estonia (n=7) |
3.28 |
1.99 |
0.62 |
1.64 |
21.55 |
65.31 |
0.45 |
0.39 |
0.82 |
0.17 |
3.06 |
0.72 |
| Central Asian Turks (n=2) |
15.51 |
14.66 |
0.19 |
2.02 |
12.43 |
27.26 |
0.00 |
0.00 |
0.00 |
22.40 |
5.20 |
0.34 |
Historical evolution of genetic admixtures by region
Follow-up
Discuss the Eupedia Ancient Ethnicities Analyzer and share your results on the Eupedia Forum.


